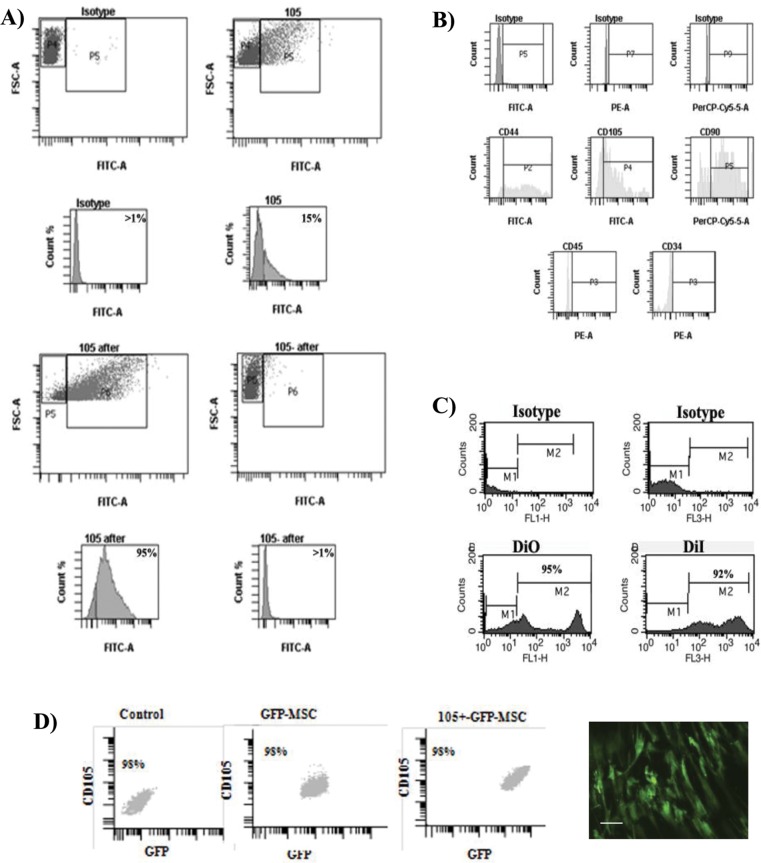
Fig 1. Characterization of CD105+-MSCs used in the cell therapy.
A) Selective enrichment of CD105+ expressing cells. Fluorescence-activated cell sorting (FACS) analysis of the subpopulations of CD105+ pre-sorted (on the top) and post-sorted (on the bottom) from synovial membrane. 105 after was subpopulation of CD105+ post-sorted (on the left bottom) and 105- after was subpopulation of CD105- post-sorted (on the right bottom). B) Characterization by flow cytometry analysis of the CD105+-MSC population using MSCs markers, CD44, CD105, CD90 and haematopoietic markers CD45 and CD34. C) Flow cytometry of subpopulation of CD105+-MSC labelled with oxacarbocyanine (DiO) and octadecyl (C18) indocarbocyanine (DiI) respectively. D) Characterization of GFP-CD105+-MSCs used to validate previous data obtained using DiO- CD105+-MSCs and DiI-CD105+-MSCs in animal model. Fluorescence-activated cell sorting (FACS) analysis of the MSCs populations (on the left), GFP-MSCs (on the middle) and post-sorted for CD105+ (on the right) from synovial membrane. Representative image of GFP-CD105+-MSCs in a plate before injection, bar represents 20 μm.

