
Fig 6. GFP-CD105+-MSCs migration study.
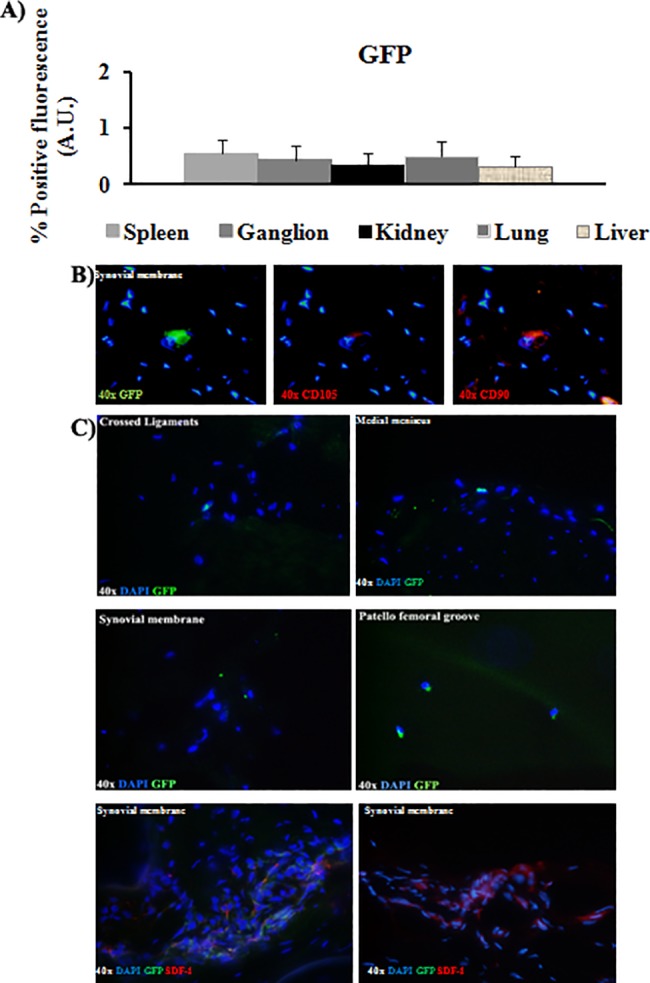
A) Quantitative analysis was done by AnalySIS Image software from organs where GFP-CD105+-MSCs were found to determine levels of positive GFP fluorescence in front of DAPI signal. B) Co-localization of GFP-CD105+-MSCs with antibodies against anti-CD105 and anti-CD90 in synovial membrane sections of left knee from animals IV injected with GFP-CD105+-MSCs. All pictures have same magnification 40x. C) Representative pictures of GFP-CD105+-MSCs from crossed ligaments, synovial membrane, medial meniscus, and patella femoral groove and immunofluorescence analysis for SDF-1 of sections from synovial membrane from animals IV injected with GFP-CD105+-MSCs. All the sections are from the left knee with OA pathology (magnification 40x).