
FIGURE 2.
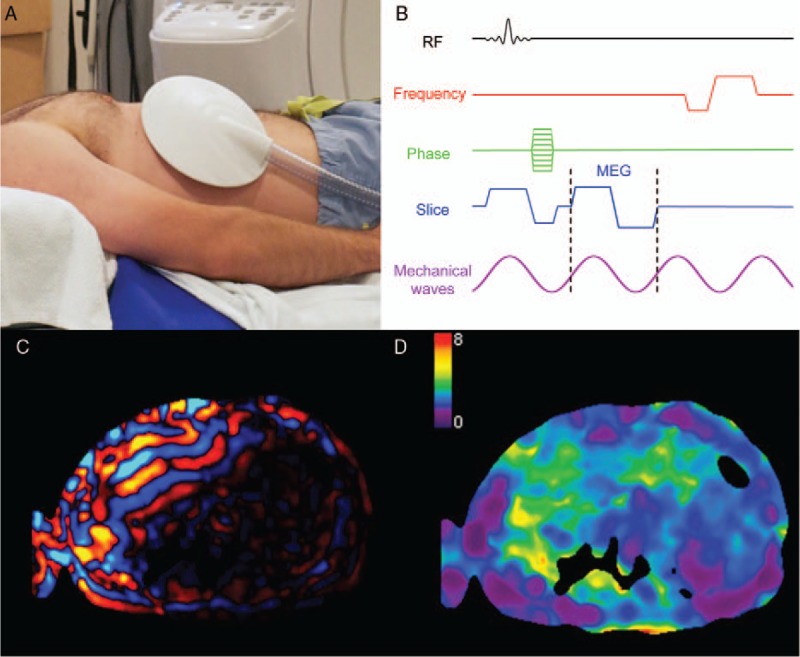
Illustration of the steps involved in magnetic resonance elastography. A, The passive driver (shown) is positioned over the patient's liver and secured with an elastic band under a phased-array torso coil (not shown). B, The induced vibrations create shear waves which are phase encoded with bipolar motion encoding gradients (MEG) shown on this MRE pulse sequence diagram. C, A shear wave image is shown, with positive amplitude values represented in red and negative values in blue. D, Elastograms are calculated by solving an inverse problem and represent the liver stiffness (illustrated on a scale from 0 to 8 kPa in this example). Figure 2 can be viewed online in color at www.topicsinmri.com.