
FIGURE 3.
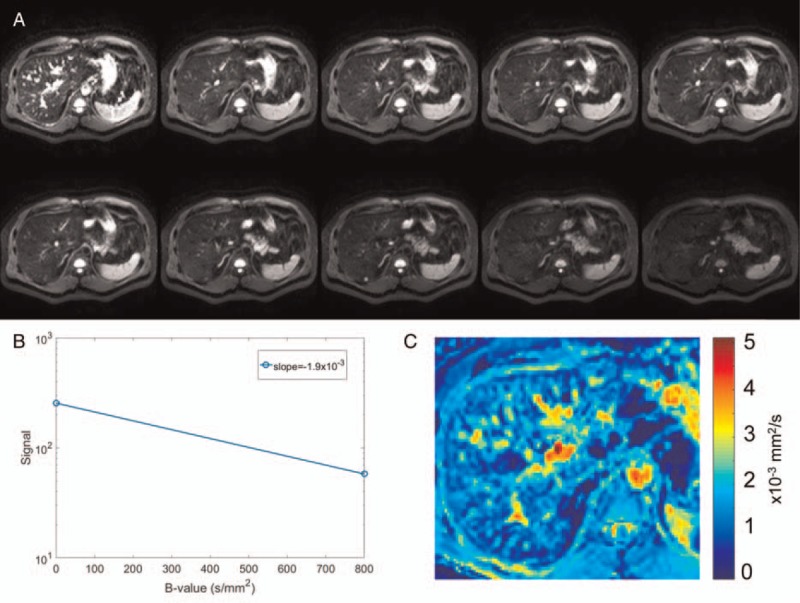
Diffusion-weighted images acquired (A) with diffusion weighting (b = 0, 10, 20, 30, 40, 50, 100, 200, 400, and 800 s/mm2). B, The signal from the 2 extreme b values is plotted semilogarithmically as a function of their b value and a linear regression is used to extract the apparent diffusion coefficient ADC (mm2/s) for a given pixel. C, A color parametric map of ADC values is computed for each pixel of the image. Figure 3 can be viewed online in color at www.topicsinmri.com.