
FIGURE 4.
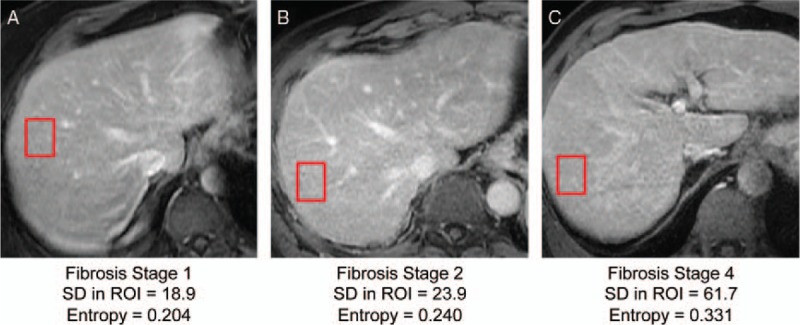
Examples of contrast-enhanced images in 3 different patients with chronic liver disease and fibrosis stages (A) 1, (B) 2, and (C) 4 documented by liver biopsy. Note the coarser texture (visually assessed) of the liver, higher standard deviation (SD), and higher entropy in regions of interest (red rectangles) associated with higher fibrosis stages. Figure 4 can be viewed online in color at www.topicsinmri.com.