
FIGURE 6.
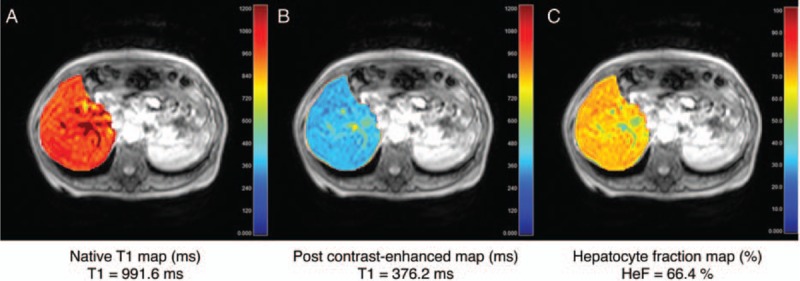
T1 map of the liver (A) before and (B) after administration of gadoxetate disodium imaged in hepatobiliary phase. C, The hepatocyte fraction map can then be calculated from the ΔR1 maps of the liver. These 3 images were acquired in a patient with liver fibrosis stage 4 (cirrhosis). Image courtesy of Tomoyuki Okuaki (Philips Healthcare, Tokyo, Japan). Figure 6 can be viewed online in color at www.topicsinmri.com.