
FIGURE 7.
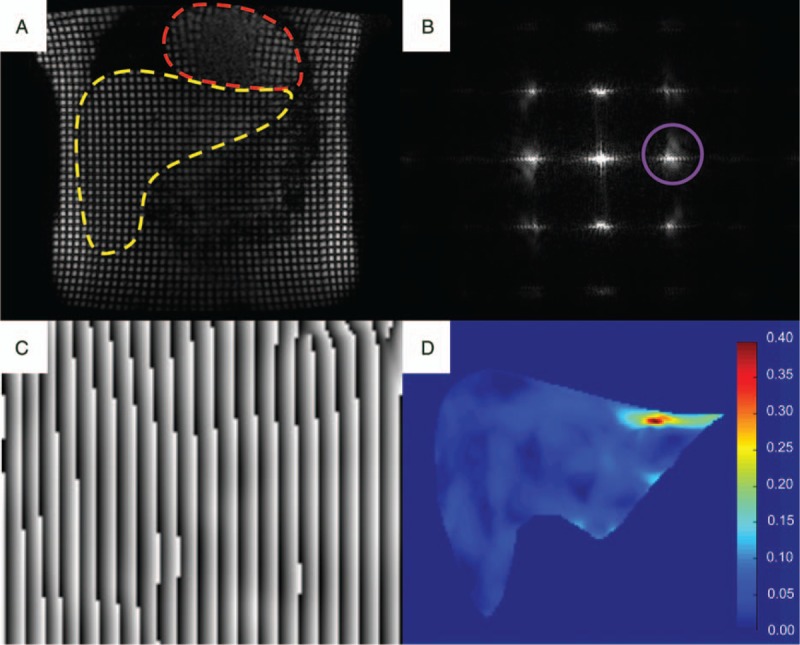
Illustration of the steps involved in cine-tagging strain imaging. A, First, a series of. tagged images are acquired throughout the cardiac cycle: coronal image showing the heart (red hatched line) and liver (yellow hatched line). B, In the frequency domain, the modulation of the images by the sinusoidal grid creates harmonic peaks at the spatial frequency of the tags. By isolating one of these peaks (purple circle) in the x and y directions, (C) phase images allow the reconstruction of the positions of the tags which can be tracked to measure (D) the strain map (unitless). Figure 7 can be viewed online in color at www.topicsinmri.com.