
FIGURE 8.
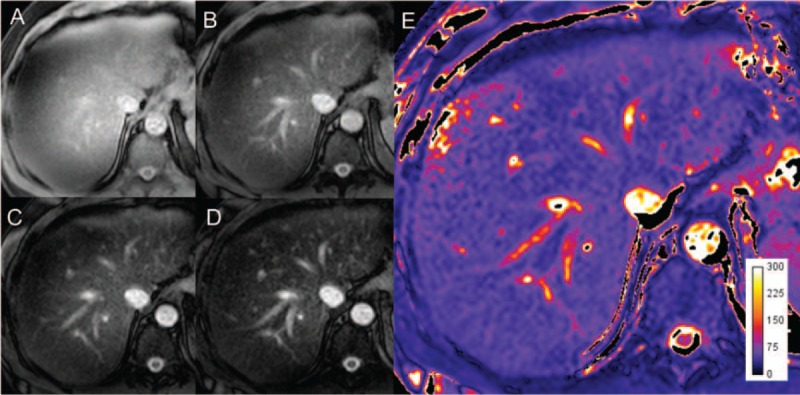
Following the application of an RF pulse, images acquired at 4 different spin-lock times, (A) 1 ms, (B) 20 ms, (C) 40 ms, (D) 60 ms allow the calculation of (E) the T1ρ map by fitting the signal to an exponential function. The map units are in milliseconds. Figure 8 can be viewed online in color at www.topicsinmri.com.