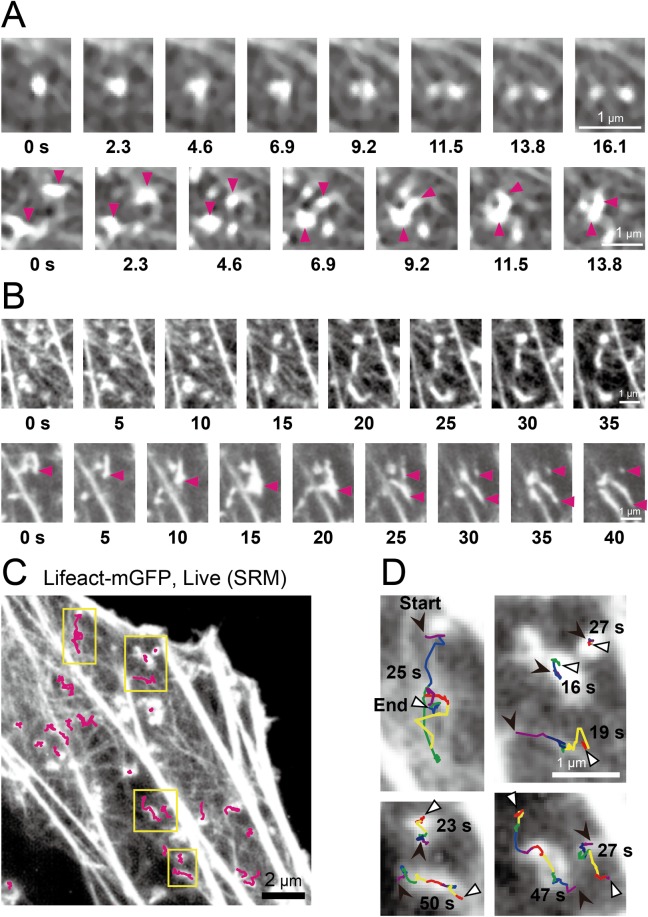
Fig 4. Actin-pl-clusters exhibited continuous dynamic morphological changes and movements on and along the cortical actin meshwork, linking actin filaments (acting as nodes in the meshwork).
(A) Images of actin-pl-clusters visualized by Lifeact-mGFP were obtained using a Nikon N-SIM system operated at a time resolution of 2.3 s (clipped from S2 Movie). In the first image sequence, the cluster split into two separate clusters. In the second sequence, the cluster indicated by the arrowheads translocated along the mesh and merged into the larger cluster. (B) Images of actin-pl-clusters visualized by Lifeact-mGFP were obtained using an Olympus SD-OSR system operated at a time resolution of 0.5 s, and were sampled every 5 s (sampled and clipped from S1 Movie). In the first image sequence, the cluster in the center elongated and the cluster in the left-bottom corner underwent merging, elongation, and shrinkage. In the second image sequence, the cluster indicated by the arrowhead in the image at 0 s elongated and spread to form a fork morphology, and then split into two fragments. One of these fragments underwent shrinkage, as indicated by the second arrowhead in the image at 25 s. (C) Individual actin-pl-clusters that fit into a square region of 0.6 × 0.6 μm, as observed using Olympus SD-OSR system at a time resolution of 0.5 s, were traced using the single fluorescent-molecule tracking software we previously developed, and their trajectories were superimposed on the SRM image (top-right region in S1 Movie). (D) The trajectories in the yellow regions in C were magnified by a factor of 3.3 and were color-coded into different colors every 5 s (in the order of purple, blue, green, orange, red, and then back to purple). The black and white arrowheads indicate the start and end positions, respectively.

