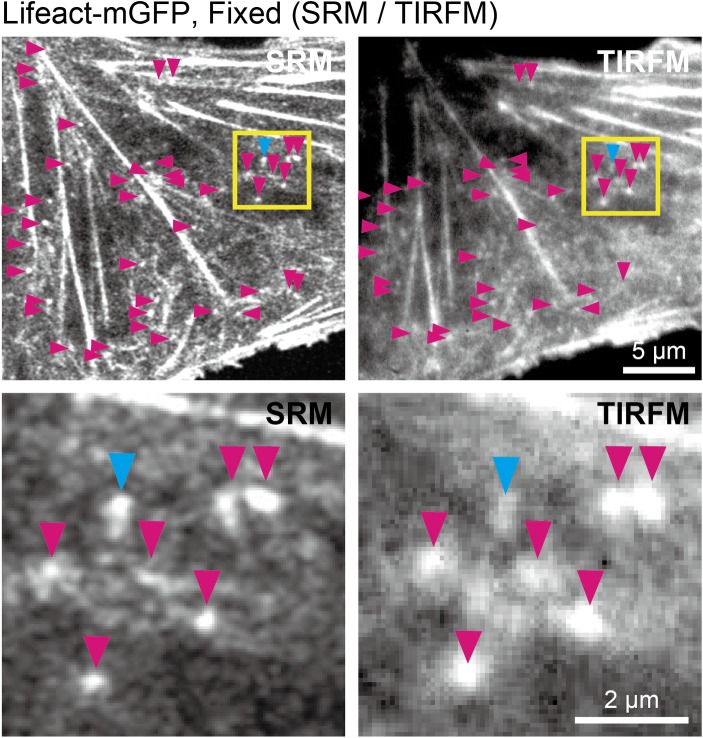
Fig 5. Comparison of actin-pl-cluster images observed by TIRFM with those by SRM.
(Top) Observations of NRK cells expressing Lifeact-mGFP after fixation was performed in the same field of view, first (Top-left) with a Zeiss Airyscan SR microscope (38 nm/pixel) and then (Top-right) with our custom-built TIRF microscope based on a Nikon Ti-E inverted microscope (68 nm/pixel). Arrowheads indicate the actin-pl-clusters observed in each image. (Bottom) The regions within the yellow boxes in the top images are magnified in the bottom images. The magenta arrowheads indicate the actin-pl-clusters observed in both the SRM and TIRFM images and the cyan arrowheads indicate an actin-pl-cluster that could be observed clearly in the SRM image, but was blurred in the TIRFM image.

