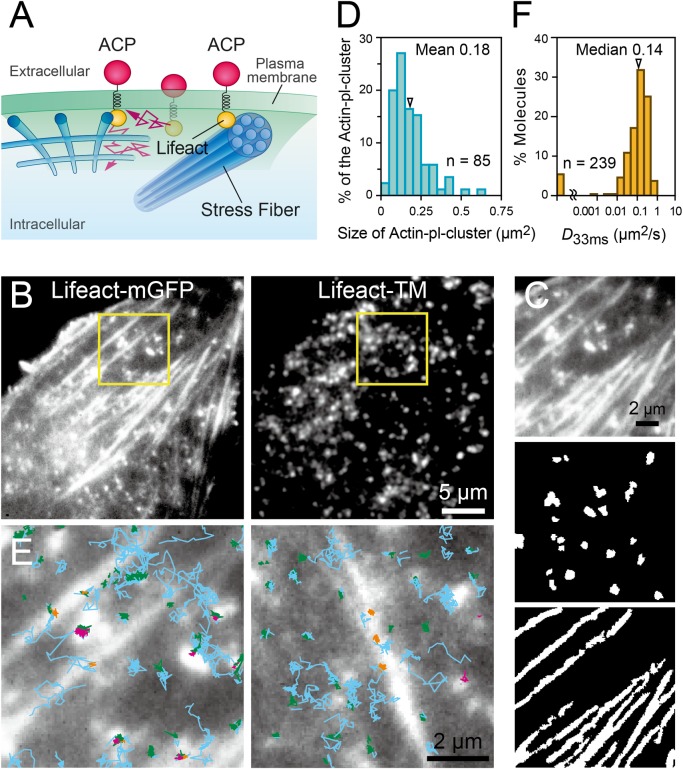
Fig 7. A newly developed probe, Lifeact-TM, detected actin-pl-clusters closely apposed to the ventral membrane.
(A) Schematic diagram of a newly developed probe for the detection of actin-concentrated structures (including mesh-like structures, stress fibers, and actin-pl-clusters) in close proximity to the PM cytoplasmic surface, named Lifeact-TM, with an ACP tag for fluorescence labeling as the extracellular domain. (B) Snapshot images from two-color TIRFM observations of (Left) Lifeact-mGFP to visualize actin-pl-clusters and (Right) single Lifeact-TM molecules labeled with SeTau647. (C) (Top) The region within the yellow square of the Lifeact-mGFP image shown in B Left. The image was binarized to optimally extract (Middle) actin-pl-clusters and (Bottom) stress fibers. (D) The area size distribution of binarized actin-pl-clusters (85 clusters in five cells). The arrowhead indicates the mean value. (E) (Left) The single-molecule trajectories of Lifeact-TM obtained at 60 Hz (16.7-ms time resolution) are superimposed on the Lifeact-mGFP image shown in C Top. Temporary immobilizations, or TALL events, were detected within each trajectory (see the TALL Detection section in the Materials and Methods), and were color-coded based on their mobility and location: blue indicating the mobile period, and magenta, yellow, and green indicating the TALL periods that occurred in the regions of actin-pl-clusters, stress fibers, and elsewhere, respectively. For the original image sequence, see S3 Movie. (Right) Another representative TALL analysis result in a different cell. (F) The distribution of the diffusion coefficients on the time scale of 16.7–50 ms (D33ms) of Lifeact-TM during the mobile period (239 trajectories in five cells). The arrowhead indicates the median value.

