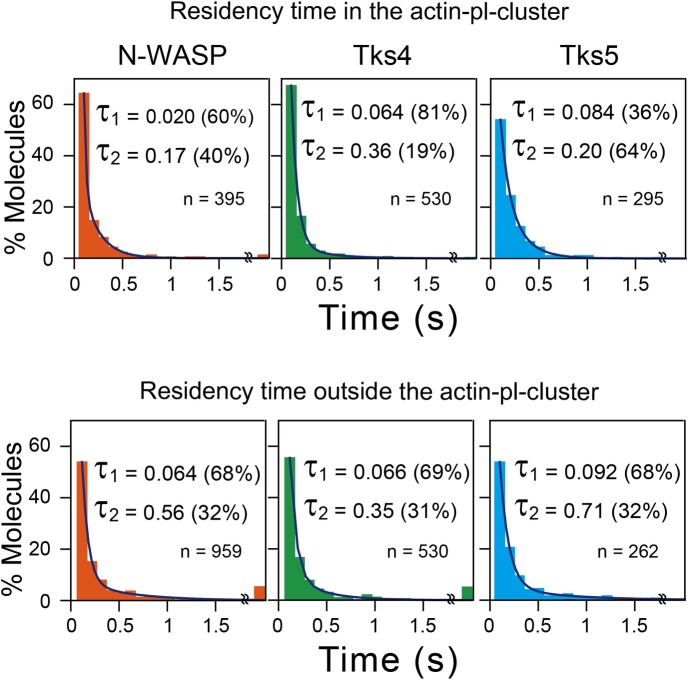
Fig 11. Residency times of N-WASP, Tks4, and Tks5 at the actin-pl-clusters and at the PM outside the actin-pl-clusters.
(Top) The histograms show the distributions of residency times of individual N-WASP, Tks4, and Tks5 molecules at the actin-pl-clusters. Each distribution could be fitted well by the sum of two exponential functions, yielding the two exponential decay constants with the fraction (%) of each population. The decay constants were then corrected for the photobleaching lifetime of TMR bound to the Halo protein (6.2 s), and the shorter residency time of τ1 and the longer residency time of τ2 were obtained. For N-WASP, τ1 = 0.020 ± 0.0040 (60%) and τ2 = 0.17 ± 0.017 (40%), for Tks4, τ1 = 0.064 ± 0.0018 (81%) and τ2 = 0.36 ± 0.059 (19%) and for Tks5, τ1 = 0.084 ± 0.026 (36%) and τ2 = 0.20 ± 0.038 (64%). The error bars indicate the 68.3% confidence limit of the fitting, and the numbers of recruitment events (n = 395 for N-WASP, n = 530 for Tks4 and n = 295 for Tks5) were obtained from five cells for each molecule. Since trajectories as short as 1–3 frames (shorter than 50 ms at 60 fps) often include those produced by transient background noise, these short trajectories were excluded from the analysis to avoid overestimation of the number of recruitment events with short residency lifetimes (thus the x-axes of the graphs start from 67 ms). (Bottom) The histograms show the distributions of residency times of individual N-WASP, Tks4, and Tks5 molecules at the PM outside the actin-pl-clusters. For N-WASP, τ1 = 0.064 ± 0.0098 (68%) and τ2 = 0.56 ± 0.22 (32%), for Tks4, τ1 = 0.066 ± 0.0037 (69%) and τ2 = 0.35 ± 0.044 (31%) and for Tks5, τ1 = 0.092 ± 0.0047 (68%) and τ2 = 0.71 ± 0.15 (32%). The recruitment events (n = 959 for N-WASP, n = 530 for Tks4 and n = 262 for Tks5) were obtained from five cells for each molecule.

