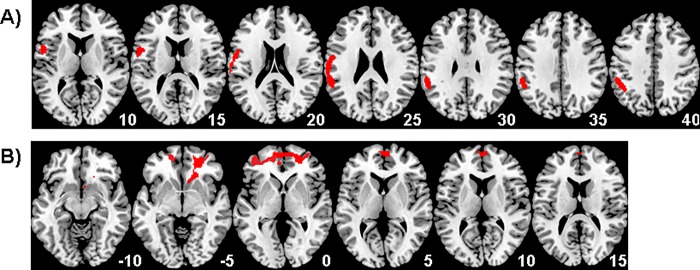
Fig 1. Functional connectivity differences between 21 physically maltreated young people and 27 healthy controls for the 8s delay condition vs 0.5s baseline.
Illustrating regions that demonstrated reduced connectivity for maltreated participants compared to healthy controls with A) the seed region of the left dorsolateral prefrontal cortex and B) the left inferior parietal seed region. The threshold is P < 0.05 FWE corrected at the cluster level. Z-coordinates represent distance from the anterior–posterior commissure in mm. The right side of the image corresponds to the right side of the brain.

