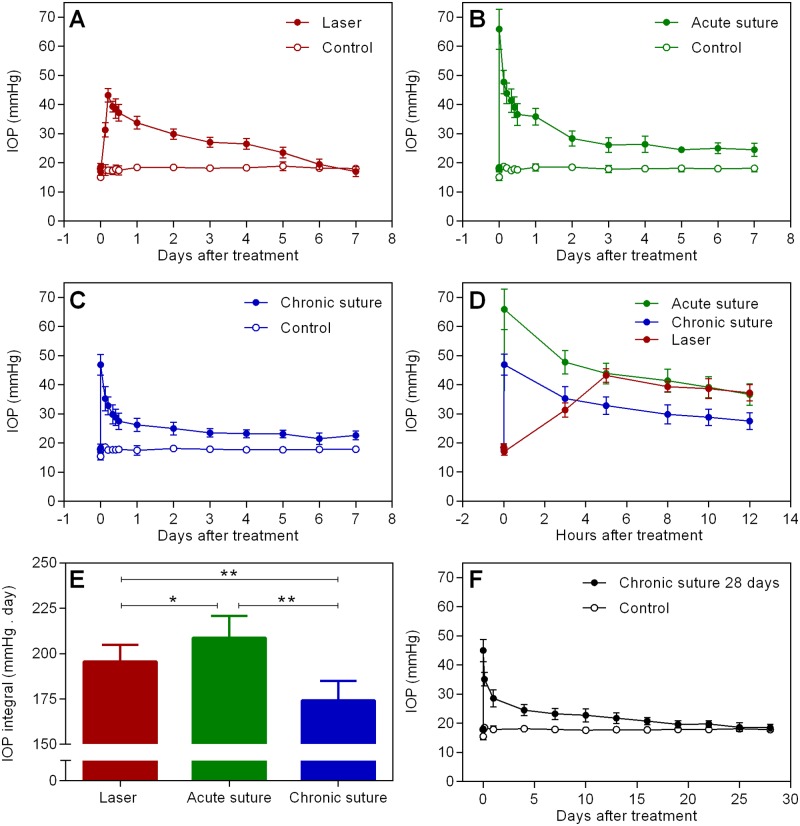
Fig 1. IOP data.
Average IOP in the laser (A), acute suture (B) and chronic suture (C) group across 7 days. (D) Comparison of IOP in the treated eyes (first 12 hours) shown in Panels A, B and C. (E) Results of IOP integral over 7 days. The acute suture group had the highest IOP integral among the 3 groups, and IOP integral in the laser group was significantly greater than that in the chronic suture group. (F) Average IOP in the chronic suture 28-day group. * p < 0.05, ** p < 0.01, mean ± SD, n = 9 in the laser group, n = 8 in the acute suture group, n = 11 in the chronic suture group, n = 12 in the chronic suture 28-day group.

