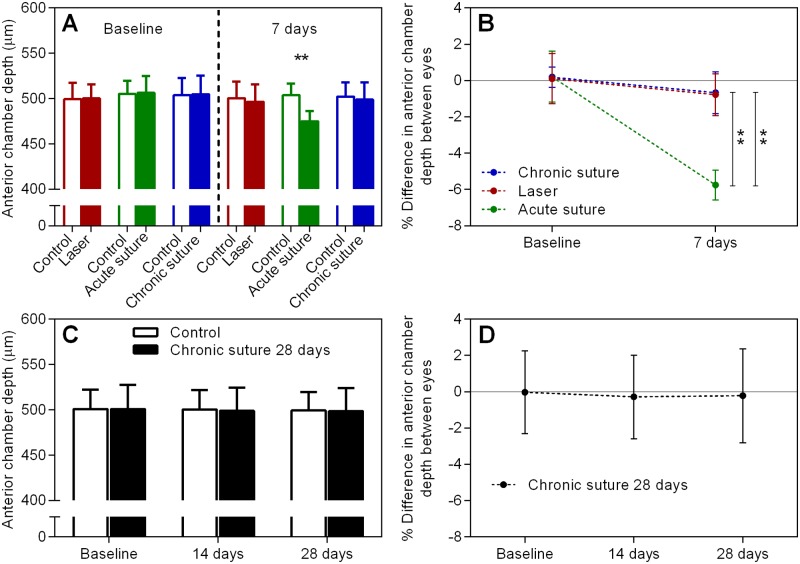
Fig 2. ACD data.
(A) Average ACD at baseline and 7 days in all 7-day groups. (B) The percentage change between treated and control eyes in the groups shown in (A). (C) & (D) as described for (A) & (B), individually, but for the chronic suture 28-day group. ** p < 0.01, mean ± SD, n = 9 in the laser group, n = 8 in the acute suture group, n = 11 in the chronic suture group, n = 12 in the chronic suture 28-day group.

