
Fig 2. Density plots of anticipated pride, guilt, as well as control group distributions.
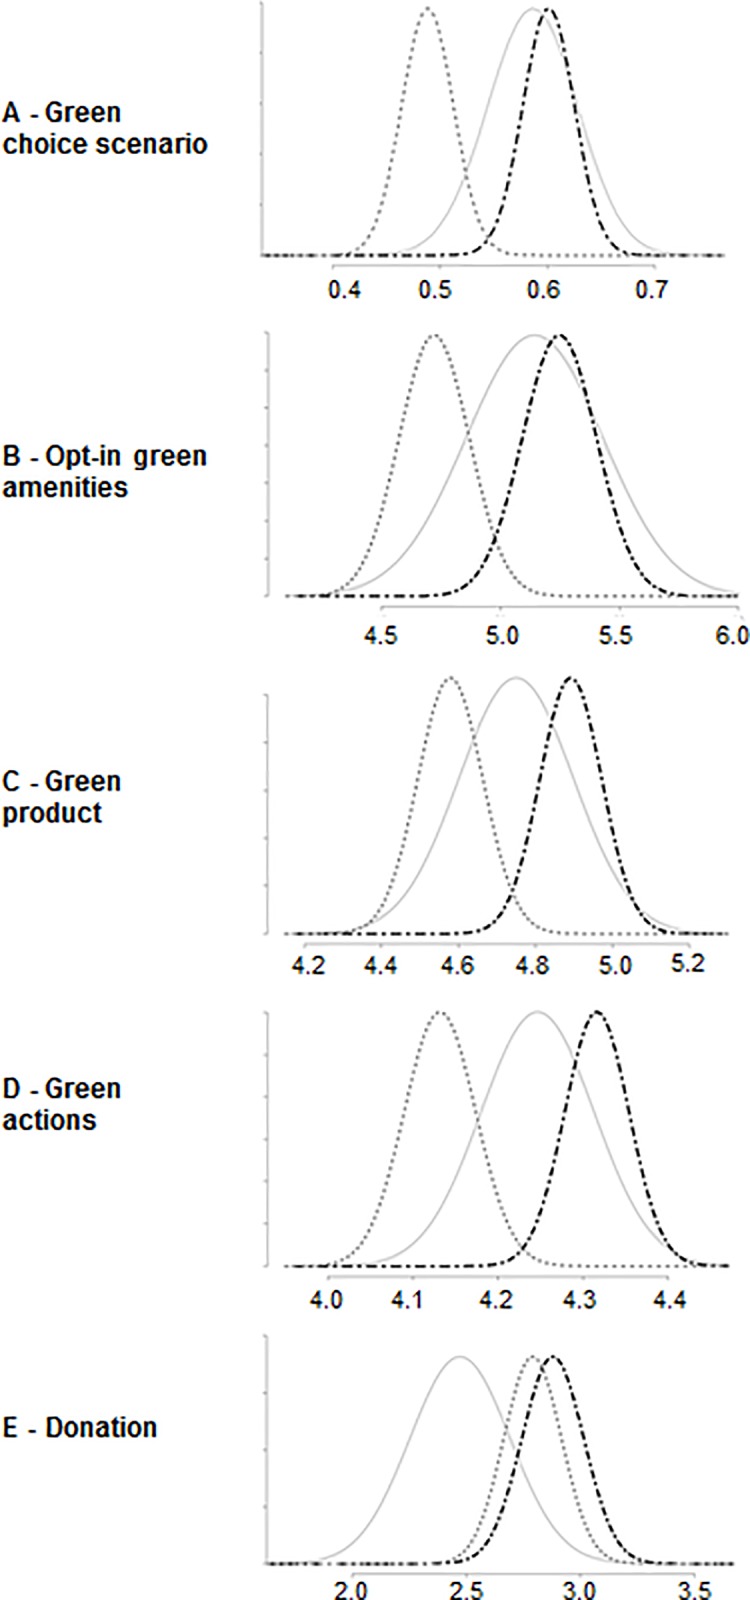
Y-axis: probability density; X-axis: (A) = proportion of green choice; (B) = number of amenities chosen, range 0 to 14; (C) = intention to buy green product over next month, range 1 (not at all likely) to 7 (extremely likely); (D) = how often participant intends to perform a series of pro-environmental actions, range 1 (never) to 6 (all the time); (E) = donation amount, range $0 to $10; legend: solid grey line = control group distribution, dotted dark grey line = guilt induction group distribution, black doted-dashed line = pride induction group distribution.