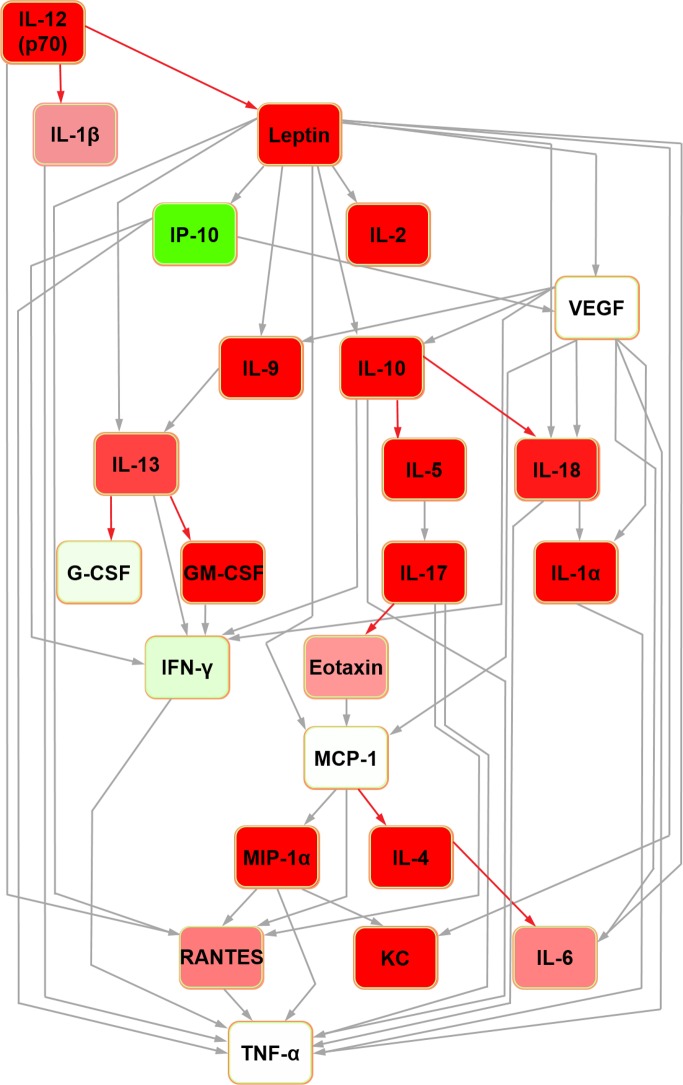
Fig 1. Bayesian network depicting cytokine interrelationships in rat seminal fluid.
The nodes are colour-coded according to the conditional probability of corresponding mediator relative concentrations being high (green), low (red) or medium (white) concentration given the state(s) of their parent nodes. Relative to the white colour, the normalised concentration (low or high) determines the intensity of the node colour. Grey-coloured confidence level edges (causal connecting arrows between nodes) represent a confidence level of 80%; red edges are below this level, based upon the confidence analysis of the Bayesian result.

