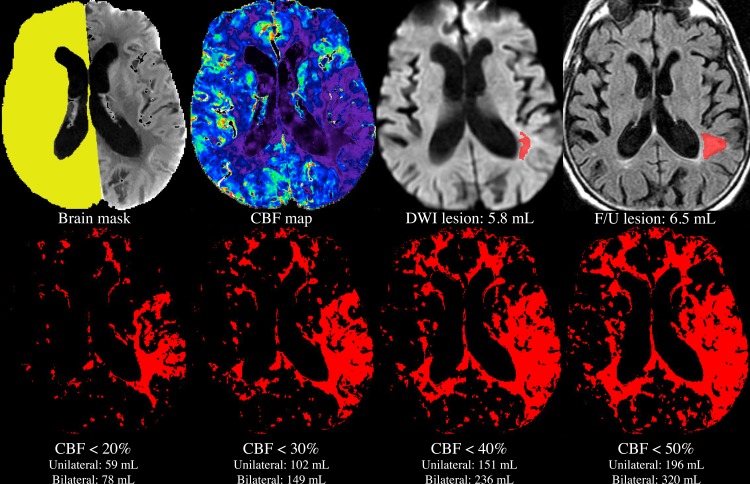
Fig 1. Image analysis process for a single patient.
A mask was manually drawn on the noncontrast “base” CTP images (top left), and used to exclude pixels lying in within the ventricles, and on the side where clinical data suggested an ischemic lesion might be present. The mean of CBF values in the remaining pixels (yellow) was used to compute relative CBF values in the entire brain (top row, second from left). The DWI lesion was outlined manually (top row, second from right), without reference to any CT images. Using each of the unilateral and bilateral methods, volumes of voxels with CBF values lying below each of various thresholds were calculated automatically (bottom row, red pixels), and compared to the manually outlined, gold-standard DWI core lesion volume (top row, second from right). For patients who underwent follow-up imaging, the CBF- and DWI-derived core lesion volumes were also compared to the volume of the infarct, as outlined manually in follow-up images (top right). Note that all of the above images have the same spatial location, with the exception of the follow-up image. As follow-up images were not coregistered to the acute images, the location of the follow-up image only approximates that of the acute images.

