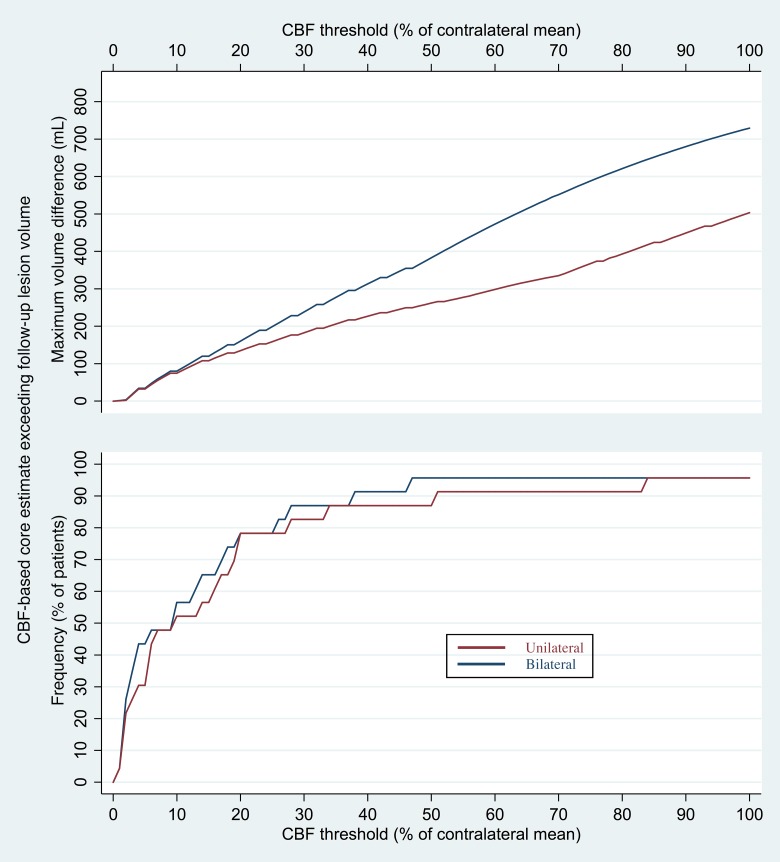
Fig 5. Frequency and maximum amount by which core volume estimates exceeded follow-up infarct volumes.
The bottom graph shows the percentage of patients with available follow-up images for whom the initial core volumes derived from CBF maps using the unilateral (red) and bilateral (blue) methods were known to be inaccurate, in that they exceeded the volumes of infarcts seen on follow-up imaging. The top graph depicts the maximum amounts by which each CBF threshold’s core volumes exceeded follow-up infarct volume.

