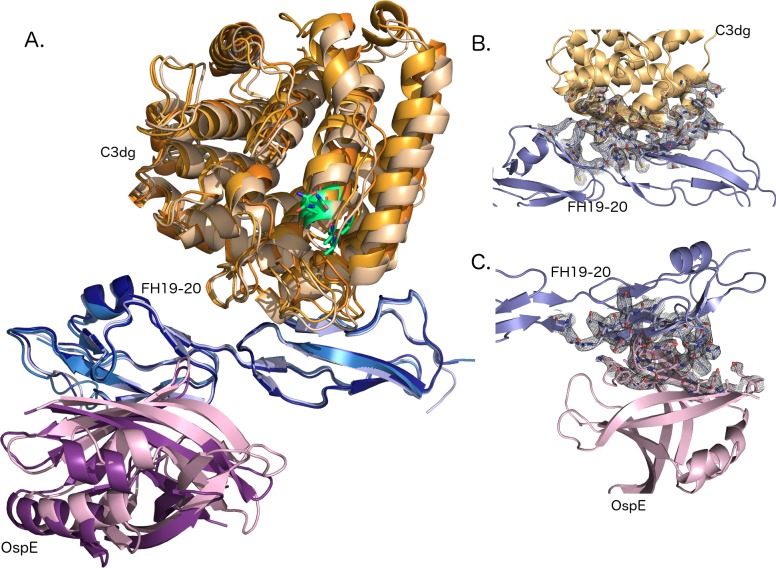
Fig 1. Overall architecture and interfaces of the complex.
(A) C3dg on top (chain A: light orange, chain B: orange, chain C: dark orange), FH19-20 across (chain D: light blue, E: sky blue, F: deep blue) and OspE on the bottom (chain G: pink, I: violet purple). FH is sandwiched between C3dg and OspE and binds C3dg mainly via domain 19 and OspE on the opposing site via domain 20. Position of the thioester and amino acids involved is C3dg is marked using green. (B) A σA weighted electron density map of the binding interface between C3dg and FH19. A cartoon model of C3dg, chain A, is shown in orange on top and FH19-20, chain D, below in blue. Residues involved in binding are shown with electron density around them. (C) A σA weighted electron density map of the binding interface between and FH20 and OspE. FH, chain D is above and OspE, chain G is below. Residues involved in binding are shown as stick model in the electron density.

