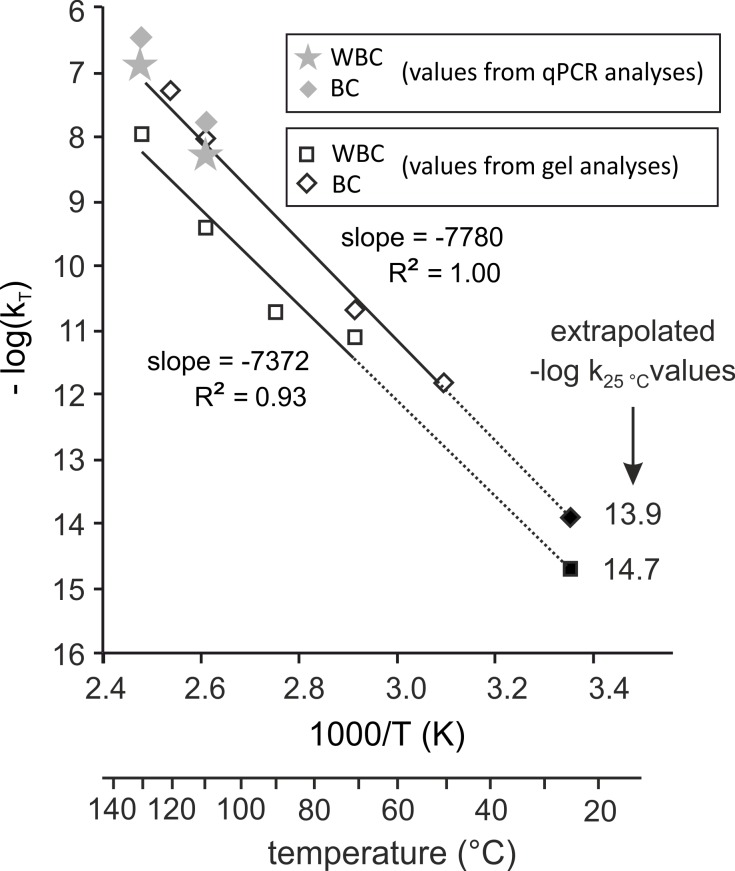
Fig 7. Arrhenius plots for DNA degradation of encapsulated WBC and BC.
The DNA degradation rate constants, kT, were calculated either from qPCR analyses (grey symbols) or from AGE analyses (open symbols). The logarithms of kT, log(kT), were plotted as a function of the reverse of the absolute temperature (T). Correspondence between absolute temperature and temperature in°C are given on the lower x axis. The slope of–log(kT) as a function of 1/T is given for both WBC and BC minicapsules from gel analyses kT. Extrapolation values of log(k25°C) are given as “extrapolated–log k25°C values” at 25°C from “gel analysis” kT. Open symbols: kT values obtained from Lmax measures on gel analyses. Grey symbols: kT values obtained from qPCR analyses. Solid symbols: kT extrapolated -log(k25°C) from gel analyses.

