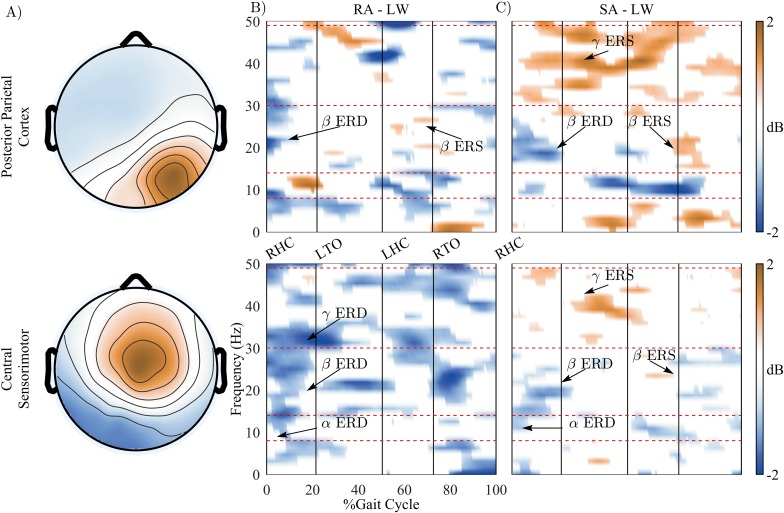
Fig 4. The changes of time-frequency spectrogram across different walking conditions.
A) Topographical scalp projections of ICs comprising in the Posterior Parietal Cortex and the Central Sensorimotor clusters. B) and C) show power changes (relative to level-ground walking periods) in the ramp ascent (RA) and the stair ascent (SA) walking conditions, respectively. Displayed are only significant power changes (p < 0.05). The blue color indicates significant power decrease (ERD) and the brown color indicates power increase (ERS).

