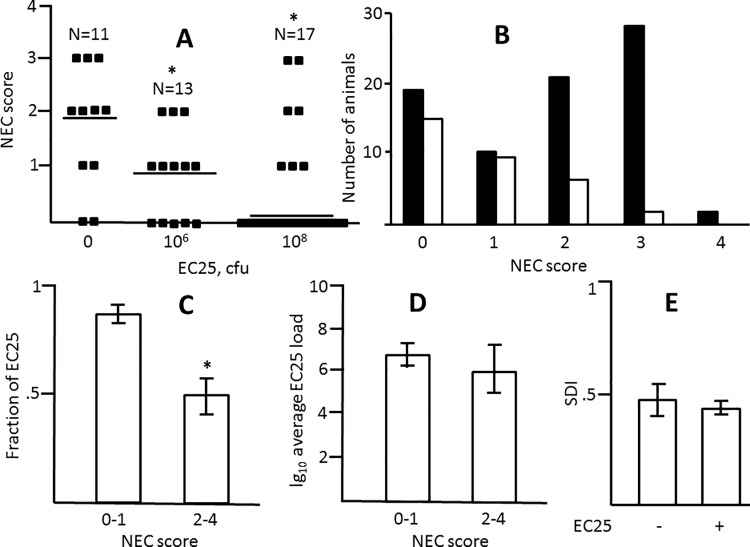
Fig 5. Effects of E. coli EC25 on NEC pathology.
A, Distribution of NEC scores in Harlan Labs rats that received 0, 106, and 108 cfu of EC25 per feeding. Horizontal bars are medians. *, significant difference from the group that received no EC25 (p<0.05). B. NEC scores in control Harlan Labs rats (solid bars) and those that received EC25 (open bars). C, Average fractions of EC25 in microbimes of NEC (score 2–4, n = 8) and no NEC (score 0–1, n = 24) rats. All animals received 106 or 108 cfu of EC25. *, significant difference, p = 0.014. D, Average logarithms of total EC25 loads in no-NEC (n = 24) and NEC (n = 8) animals. E, Average SDI with (n = 32) and without (n = 80) supplementation with EC25.

