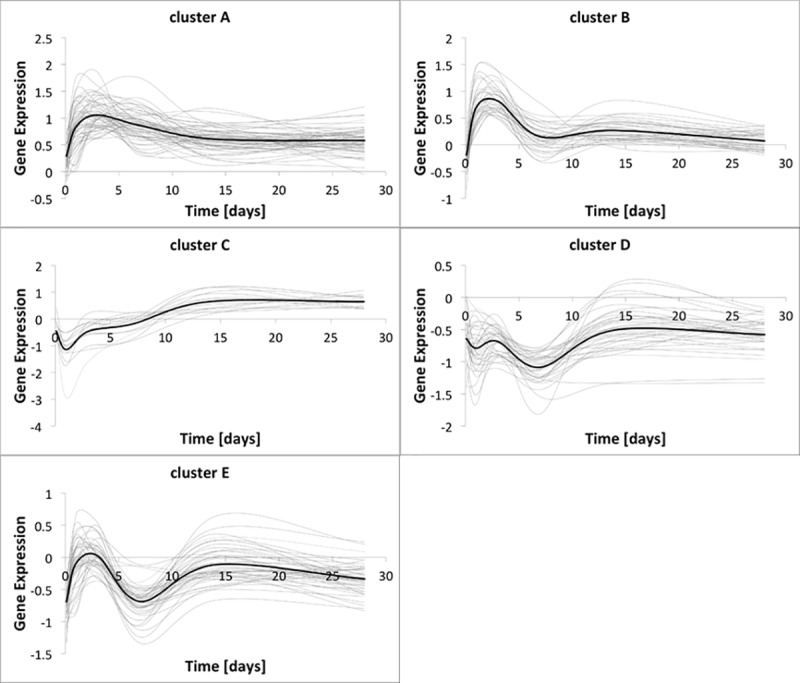
Fig 4. Genes dynamic retrieved from microarray probe for the five significant clusters.

In each graph, the dynamic of each gene is represented with a light gray solid line, while the cluster expression, intended as the mean of the genes expression, is represented with a black solid line.
