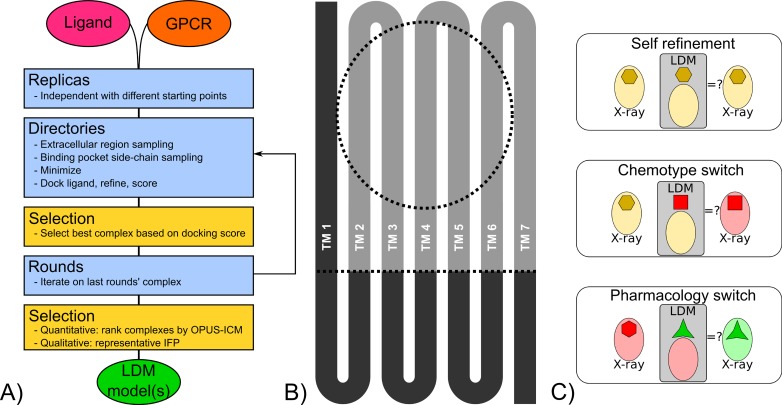
Fig 1. LDM workflow description.
A) Schematic of the LDM workflow that takes a GPCR model and a ligand as input, and outputs LDM models. Sampling steps are represented in blue while selection steps are represented in yellow. B) GPCRs are separated in regions in the LDM workflow that have increasing degree of sampling. The TM1 and cytoplasmic region are kept static (dark grey), the rest of the GPCR is flexible (light grey). The binding pocket region defines the docking area and undergoes further sampling (dotted circle). C) The LDM was evaluated with a benchmark divided into three scenarios where an origin X-ray crystal structure binding pocket is refined by the LDM using the ligand found in a destination X-ray crystal structure, referred to here as origin and destination, respectively. In self refinement, the origin and destination are the same structure, in chemotype switch, the origin and destination are bound by ligands of the same pharmacology (agonist or inhibitor) but with different chemotypes and in pharmacology switch, origin and destination are bound by ligands of different pharmacology (agonist to inhibitor or vice-versa).

