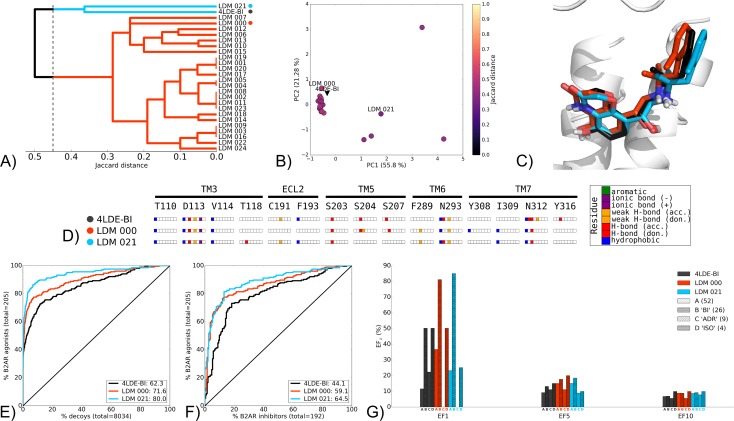
Fig 3. Self refinement LDM experiment on the B2AR 4LDE-BI, using BI as a refinement ligand.
A) Dendrogram of the top 25 LDM models and the X-ray structures, a cut-off line identifies different LDM clusters and their representative LDM models are designated by a coloured dot. Representative LDM models are the highest scoring within the cluster based on the OPUS-ICM metric. B) PCA comparison of binding pocket conformation between the top 25 LDM models and the X-ray structures. LDM models are coloured based on their IFP Jaccard distance with the destination X-ray structure, 4LDE-BI. C) Binding poses of the representative LDM models and the destination X-ray structure with the X-ray ligand in black, LDM000 in red and LDM021 in blue. D) IFP of the representative LDM models and the X-ray structure. Interaction type is described for each residue of the binding pocket: hydrophobic interaction, hydrogen bond (H-bond) donor and acceptor, weak hydrogen bond (weak H-bond) donor and acceptor, ionic bond positive (+) and negative (-) and aromatic interaction. E, F, G) VS performance with the X-ray structure in black, LDM000 in red and LDM021 in blue. E) ROC curves visualising the recovery of B2AR agonists vs. decoys. F) ROC curves highlighting the selectivity of B2AR agonists over B2AR inhibitors. For E and F, the relative rank of the LDM refinement ligand is identified with a vertical dashed line. This vertical line is not visible as it overlays the axis indicating the refinement ligand is very highly ranked in all 3 cases. The ROC curve figure insets show NSQ_AUC values for each binding pocket. G) bar chart to visualise the EF for representative B2AR agonist chemotypes at EF1, EF5 and EF10. Chemotypes A, B ‘BI-like’, C ‘ADR-like’ and D ‘ISO-like’ represent only a subset of B2AR agonist ligands (S2C Fig). The EF bar chart inset shows the number of ligands for each of these chemotype clusters between parenthesis. X-ray structure chemotype EF shown in black bars, with the LDM models coloured based on their relative clusters identified in A.

