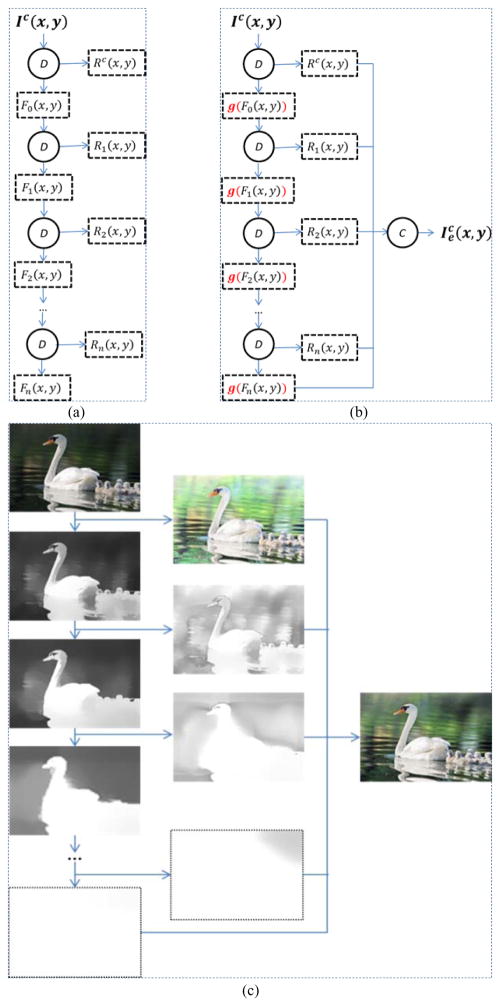
Fig. 3.
Illustration of the multi-layer model. (a) Image decomposition process. (b) Image enhancement model. Ic(x, y) represents an original image, Fi(x, y) indicates the low-frequency component, Ri(x, y) indicates the high-frequency component, indicates the enhanced image, D indicates image decomposition, C indicates image combination, and g(·) is a mapping function. (c) An example of image decomposition and enhancement using the multi-layer model. For simplicity, the operation symbols are not presented in (c).

