
Figure 6.
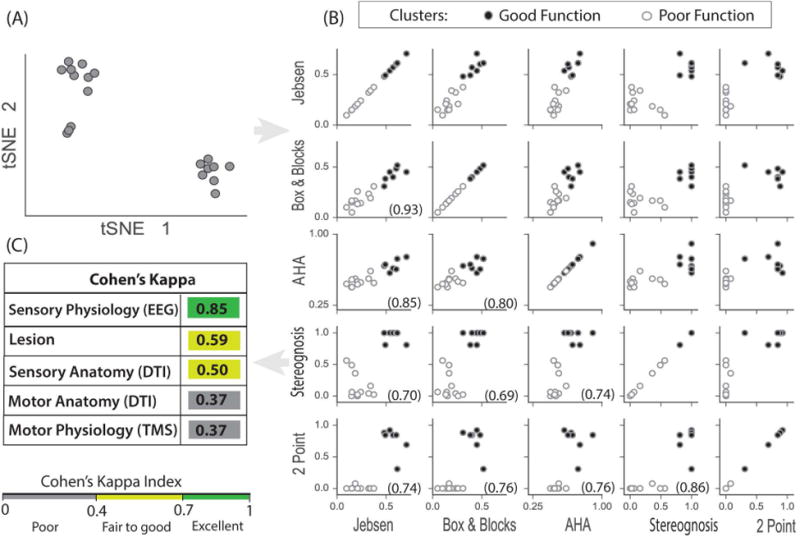
Clustering of behavioral data. (A) t-SNE allows projections of the 5 hand function tests into 2 dimensions (t-SNE 1 and t-SNE 2) which shows 2 distinct participant groups. (B) Clustering outcome from applying k-means clustering on 5 dimensional hand function data. The two clusters are marked for all pairs of hand movement and somatosensory test scores. Each circle represents a single participant, and circles are filled or open based on the 2 clusters. The clusters fall into the top right quadrant (good hand function: filled circles) and the lower left quadrant (poor hand function: open circles) for all pairs of hand function tests. All tests pairs were also significantly correlated, tested with non-parametric Spearman's rho (p < 0.001), rho is shown in each subplot in parentheses. (C) Cohen's kappa was used to estimate cluster agreement with anatomy, physiology and lesion type. Somatosensory physiology was the most sensitive indicator of good or poor hand function.