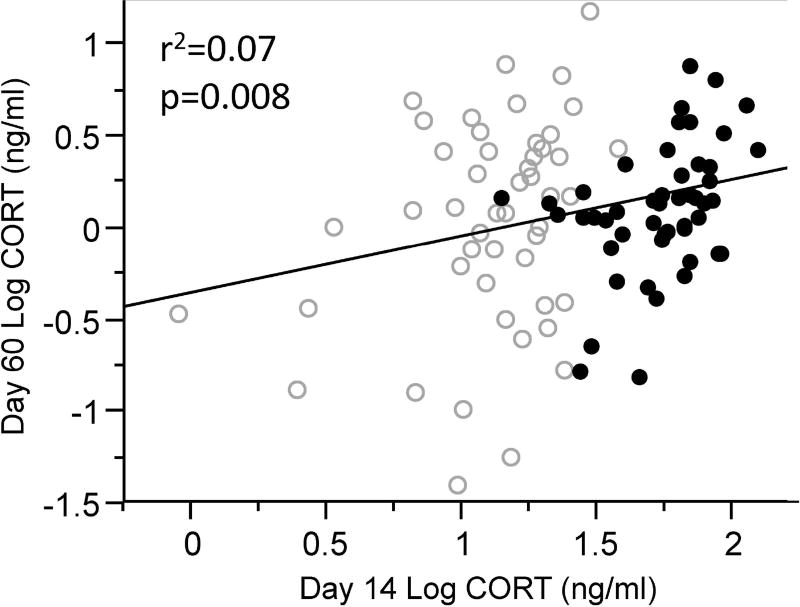
Figure 3.
Relationship between corticosterone (CORT) concentrations during the period of experimental manipulation (day 14) and after the experimental period (day 60). Points are coded by developmental treatment group. Open circles represent birds in the control group and filled circles represent birds in the group with experimentally elevated CORT levels.

