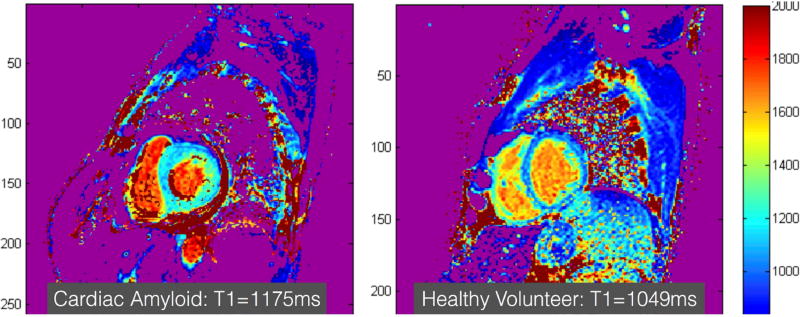
Figure 4. Cardiac amyloidosis.
Short axis images of the mid ventricle encoded with a native myocardial T1-color map generated from a series of images acquired at increasing repetition times acquired using MOdified Look Locker Image (MOLLI) pulse sequence is shown in a patient with cardiac amyloidosis (left) and a healthy volunteer (right). The T1-time shown in this figure are obtained from a region of interest drawn manually in the inter-ventricular septum. The T1-times can be even higher in patients with more extensive cardiac amyloidosis than the example shown here. Normal native T1 value on the particular scanner used to acquire these images is <1050ms.

