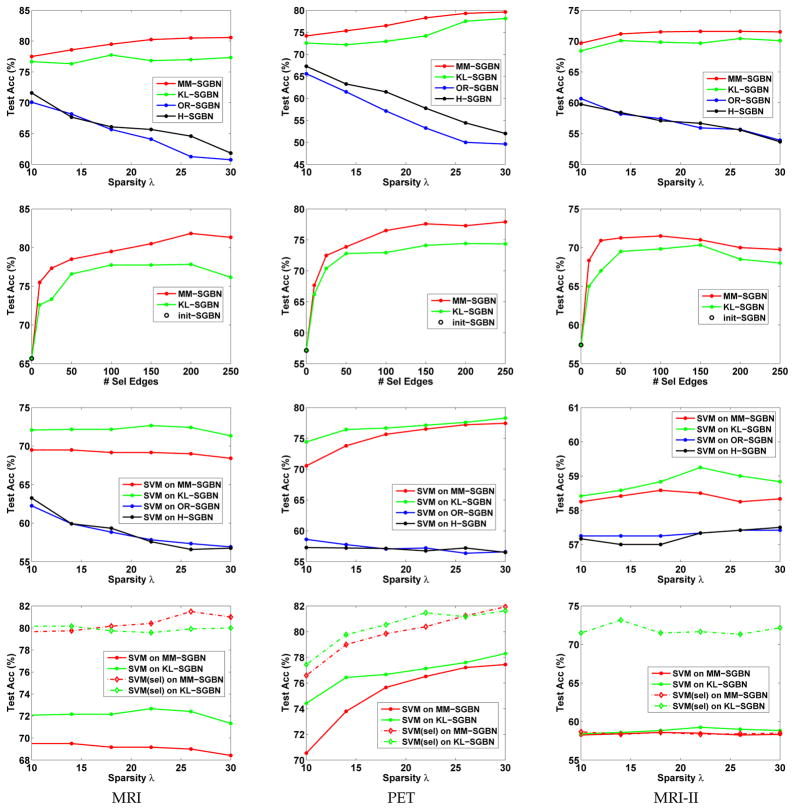
Fig. 3.
Comparison of classification accuracies on data sets of MRI (the left column), PET (the middle column) and MRI-II (the right column). The top two rows correspond to the test accuracies obtained by the learned SGBNs. The first row shows the test accuracies varied with the sparsity levels (i.e., the parameter λ). The second row shows the test accuracies varied with the number of edges (denoted as “#Sel Edges” in the figure) optimized in discriminative learning. The bottom two rows correspond to the test accuracies obtained by SVMs using the SGBN-induced Fisher vectors either in full length (the third row) or with (100) selected components (the fourth row).

