
Figure 2.
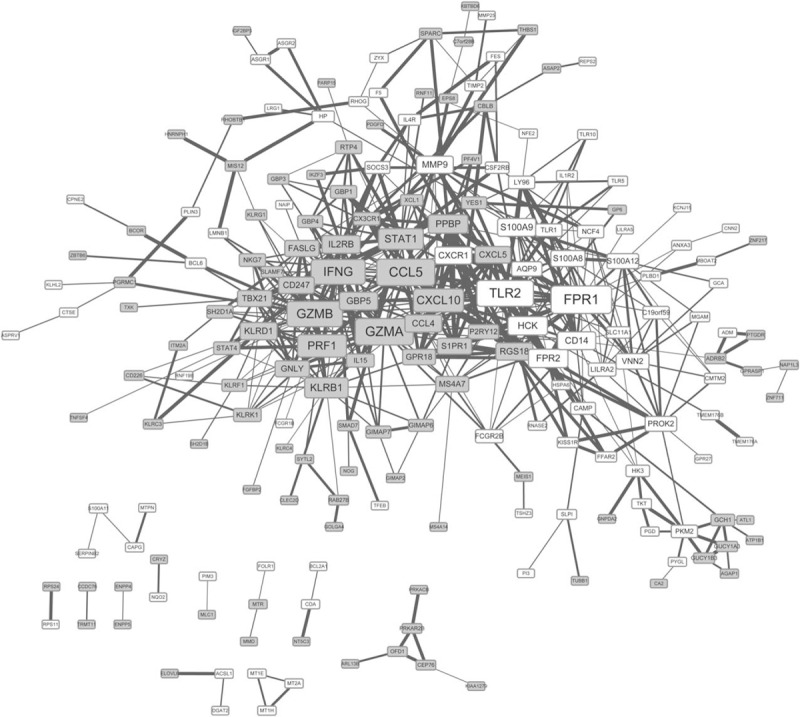
Protein–protein interaction network of the DEGs. The nodes denote the protein product of DEGs, and the lines between 2 proteins denote their correlations. In addition, the grey square-shaped nodes represent downregulated proteins of DEGs, and the white square-shaped nodes represent upregulated proteins of DEGs. The size of each node indicates the number of the interactions with other DEGs, and the boldness of the line is directly proportional to combined score between the proteins. DEG = differentially expressed gene.