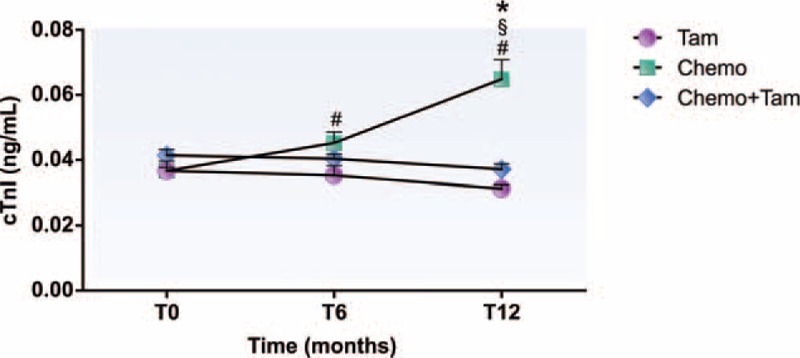
Figure 2.

Cardiac troponin I serum concentration of different groups during the 12-month follow up. #P < .05 compared with T0; §P < .05 compared with T6; ∗P < .05 compared with Tam and Chemo + Tam groups. cTnI = cardiac troponin I, T0 = before treatment, T6 = 6 months after beginning treatment, T12 = 12 months after beginning treatment, Tam = women treated exclusively with tamoxifen, Chemo = women treated exclusively with chemotherapy, Chemo + Tam = women treated with tamoxifen after chemotherapy.
