Abstract
Background:
The role of the chemoradiation therapy (CRT) and chemotherapy (CT) in the treatment of esophageal carcinoma (EC) remains controversial. Therefore, we conducted this meta-analysis to compare the efficacy and safety of CRT with CT in the treatment of EC patients.
Methods:
PubMed, Embase, Web of Science, and The Cochrane library were systematically reviewed for randomized controlled trials (RCTs) that compared CRT with CT. Outcomes included overall survival (OS), progression-free survival (PFS), pathological complete response (pCR), R0 resection, recurrence rate, mortality rate, and adverse events. Pooled estimates were expressed with hazard ratio (HR) with 95% confidence intervals (95% CIs) and risk ratio (RR) with 95% CIs.
Results:
Eight RCTs involving 1274 patients were included in this meta-analysis. Compared with CT, CRT was not associated with significantly improved OS (HR = 0.91, 95% CI: 0.82, 1.01; P = .072) and PFS (RR = 3.62, 95% CI: 1.10, 11.95; P = .035). The pCR rate and R0 resection rate were significant higher in the CRT group than that in the CT group (RR = 3.62, 95% CI: 1.10, 11.95, P = .035; RR = 1.18, 95% CI: 1.09, 1.27, P < .001; respectively). EC patients who received CRT had a higher mortality rate (RR = 2.50, 95% CI: 1.14, 5.48; P = .022) than those treated with CT, and the incidence of grade 3 or 4 adverse events was similar between the 2 groups (RR = 0.91, 95% CI: 0.62, 1.32; P = .612).
Conclusion:
On the basis of the current evidence, our results suggested that CRT seemed to have benefit in the radical resection, but no effect in the survival benefits. Further large-scale, well-conducted RCTs are needed to verify our findings.
Keywords: chemoradiation therapy, chemotherapy, esophageal carcinoma, meta-analysis
1. Introduction
Esophageal carcinoma (EC) is one of the most malignant tumors with high mortality rate in the world, with >450,000 new cases diagnosed each year.[1] Although surgery is the primary modality that can cure patients, the majority of patients present with recurrences leading to death within 2 years after resection.[2] This is particularly true for high-risk patients with locally advanced tumor stage, wherein complete resection is impossible in a relevant number of patients and lymph node metastases were observed in almost all the patients.[2–4]
Recently, chemotherapy (CT) and chemoradiation therapy (CRT) have been used as neoadjuvant therapies before or after the esophageal resection to improve the long-term survival outcomes of patients with EC. Compared with surgery, preoperative CT demonstrated superior effects in esophagogastric cancer.[5,6] Moreover, preoperative CRT also proved to result in a longer survival time than surgery.[7,8] However, whether CRT could lead to a better treatment effect than CT remains controversial. Therefore, we conducted this meta-analysis of randomized controlled trials (RCTs) to compare the effects and safety of CRT with CT in the treatment of patients with EC.
2. Material and methods
2.1. Search strategy
The meta-analysis was conducted and reported in accordance with Preferred Reporting Items for Systematic Reviews and Meta-analysis (PRISMA).[9] PubMed, Embase, Web of Science, and The Cochrane library were systematically searched from inception to February 10, 2017. The search terms used were as follows: (“oesophageal cancer”[All Fields] OR “esophageal neoplasms”[MeSH Terms] OR (“esophageal”[All Fields] AND “neoplasms”[All Fields]) OR “esophageal neoplasms”[All Fields] OR (“esophageal”[All Fields] AND “cancer”[All Fields]) OR “esophageal cancer”[All Fields]) AND ((“chemoradiotherapy”[MeSH Terms] OR “chemoradiotherapy”[All Fields] OR “chemoradiation”[All Fields]) AND (“therapy”[Subheading] OR “therapy”[All Fields] OR “therapeutics”[MeSH Terms] OR “therapeutics”[All Fields])) AND (“drug therapy”[Subheading] OR (“drug”[All Fields] AND “therapy”[All Fields]) OR “drug therapy”[All Fields] OR “chemotherapy”[All Fields] OR “drug therapy”[MeSH Terms] OR (“drug”[All Fields] AND “therapy”[All Fields]) OR “chemotherapy”[All Fields]). There was no restriction on language and publication date. We also searched manually the references of the included studies and reviews until no further studies were found.
2.2. Study selection
The following inclusive criteria were applied: study design: RCT; population (adult patients who had histologically proven squamous cell carcinoma [SCC], adenocarcinoma [AC], or adenosquamous carcinoma [ASC] of the oesophagus); intervention (CRT); control (CT); outcome (overall survival [OS], progression-free survival [PFS], pathological complete response [pCR], R0 resection, recurrence rate, mortality rate, and adverse events).
2.3. Data extraction
A standardized data-extraction sheet was used to extract the following information: first author's name, year of publication, country, number of patients in each group, patients’ characteristics, treatment regimens, and outcome data (OS, PFS, pCR, recurrence rate, R0 resection, mortality rate, and adverse events). Data extraction was conducted by 2 independent investigators (LJY and XL), and discrepancies between them were resolved by discussion and consensus, and finally decided by a third investigator (LJH). For some studies that provided Kaplan-Meier curves rather than original values, we used the method recommended by Tierney et al[10] to extract the hazard ratio (HR) as well as 95% confidence intervals (95% CIs). We also contacted corresponding author for data when it is necessary.
2.4. Risk of bias and grades of evidence
The assessment for risk of bias was conducted in adherence to guidelines outlined in the Cochrane handbook for systematic reviews of interventions (version 5.1.0).[11] The quality of included studies was regarded as being at “low,” “unclear,” or “high” of bias according to the following domains: random sequence generation; allocation concealment; blinding of participants and personnel; blinding of outcome assessment; incomplete outcome data; selective reporting; other bias.
The quality of evidence for outcome measures was assessed using the Grading of Recommendation Assessment, Development and Evaluation (GRADE) approach.[12] The GRADE profiler (GRADEpro, version 3.6) was used to construct a summary table.
2.5. Statistical analysis
We estimated the HR with 95% CI for time-to-event outcomes, and risk ratio (RR) with 95% CI for dichotomous outcomes. Before the data were synthesized, Cochrane Q χ2 test and I2statistic were used to test the heterogeneity among the included studies. A P value <.1 or I2 > 50% was considered to represent substantial heterogeneity.[13] Pooled estimates were calculated using a fixed-effects model (Mantel-Haenszel method)[14] or a randomized-effects model (DerSimonian-Laird method),[15] depending on the heterogeneity among the included studies. Whenever significant heterogeneity was identified, sensitivity analysis was conducted to explore the potential sources of heterogeneity. We also conducted subgroup analysis based on treatment procedure (definitive CRT, preoperative CRT, and postoperative CRT). The publication bias was not assessed because the number of included studies was <10.[16] A 2-tailed P value <.05 was considered statistically significant except where a certain P value had been specified. All analyses were performed using STATA version 12.0 (Stata Corporation, College Station, TX).
2.6. Ethical review
Ethical approval was not necessary because this article is a meta-analysis and it does not involve the participants of ethics committee.
3. Results
3.1. Literature search
The search process of eligible studies is shown in Figure 1. The initial database search yielded 2137 records, of which 1542 records were excluded because of duplicate records. Then 584 were excluded based on title/abstract for various reasons (letters, case report, review, or conference abstracts), leaving 11 articles for full-text review. The remaining 11 articles were assessed for eligibility, and 3 of them were excluded because 1 was a single-arm trial,[17] 1 used the chemoradiotherapy in both groups,[18] and 1 compared low-dose with standard-dose chemoradiotherapy.[19] Finally, 8 RCTs[20–27] involving 1274 patients were included in this meta-analysis.
Figure 1.

Eligibility of studies for inclusion in meta-analysis.
3.2. Study characteristics
The study characteristics are presented in Table 1. These studies were published between 1992 and 2016. The sample size ranged from 45 to 267. Of these included studies, 2 were conducted in Japan,[21,24] 1 in France,[20] 1 in Sweden,[22] 1 in China,[23] 1 in Finland,[25] 1 in Australia,[26] and 1 in Germany.[27] Among the 1274 EC patients, 606 (47.6%) were histologically diagnosed with SCC, 617 (48.4%) were AC, and 51 (4.0%) were ASC. The tumor node metastasis staging system was used in the included studies, and most of patients were clinical stage IIA/IIB/III patients. In the CT group, cisplatin and 5-fluorouracil were used as the treatment regimens in most of the included studies, and dosage of radiotherapy in the CRT group ranged from 30 to 50 Gy. The patients’ characteristics, such as performance status (PS), histological subtype, tumor location, and clinical stage were well-balanced between the two groups.
Table 1.
Baseline characteristics of patients in the trials included in the meta-analysis.

3.3. Risk of bias and data quality
The details of risk of bias are presented in Fig. 2. Among these studies, 2 were regarded as being at low risk of bias,[20,22] 5 at unclear risk of bias,[21,23–26] and 1 at high risk of bias.[27] The main reason for the study with high risk of bias was that it was not a double-blind design; the main reason for 5 studies with unclear risk of bias was that the methods of blinding were not adequately described.
Figure 2.

Risk of bias summary.
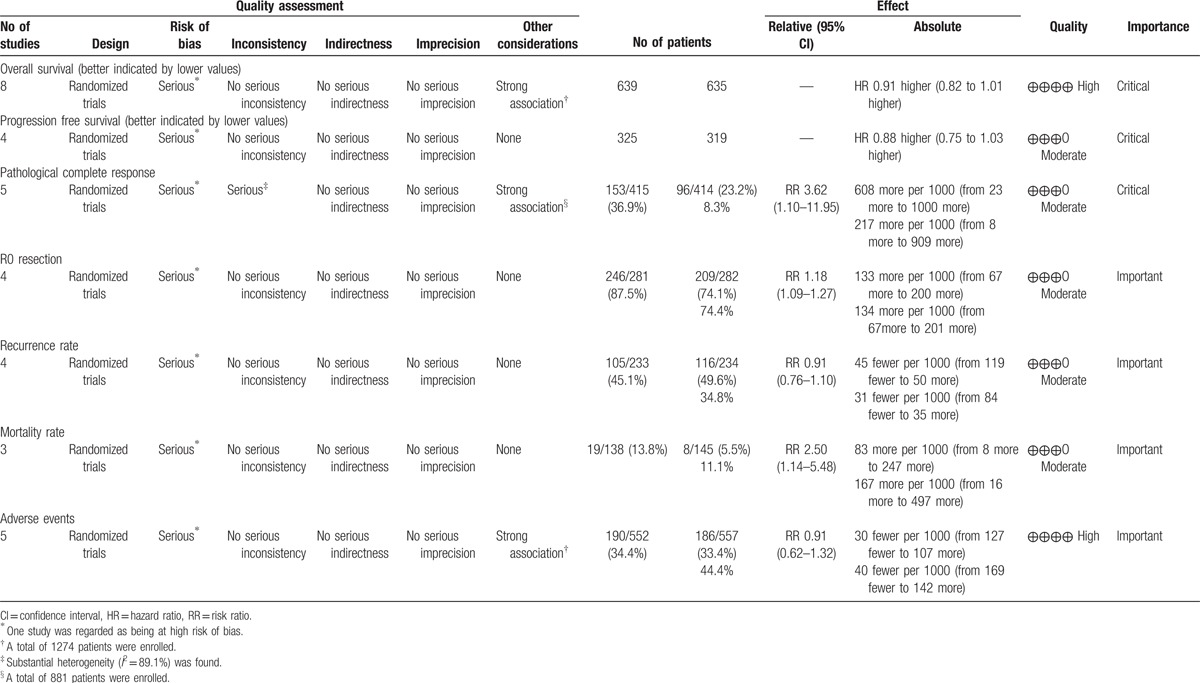
The GRADE evidence profiles for these outcomes were shown in Table 2. The quality of evidence was high for OS and adverse events, and moderate for PFS, pCR, R0 resection, recurrence rate, and mortality rate.
Table 2.
GRADE evidence profile.
3.4. OS
All the included studies reported the data of OS.[20–27] Pooled estimates suggested that CRT did not significantly improve OS as compared with CT (HR = 0.91, 95% CI: 0.82, 1.01; P = .072) (Fig. 3). There was no significant heterogeneity among the included studies (I2 = 0.0%, P = .975).
Figure 3.
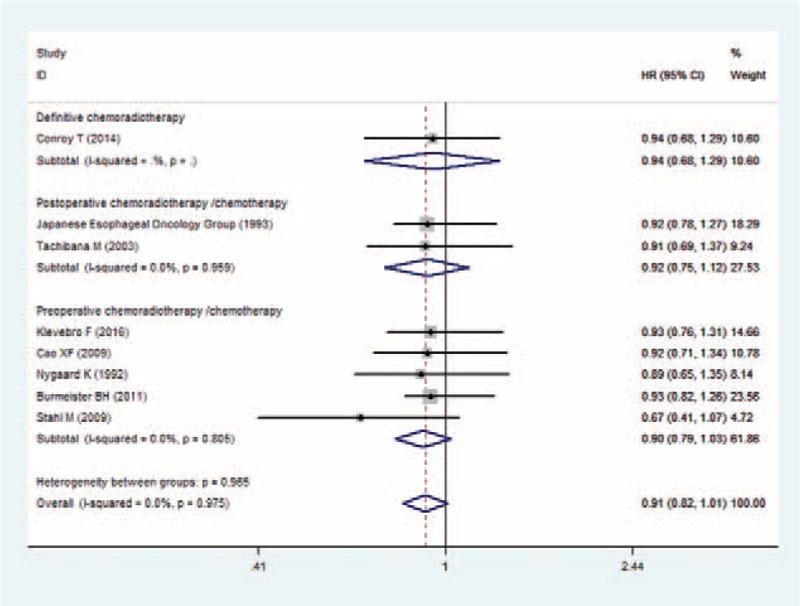
Forest plot showing the comparison between chemoradiotherapy and chemotherapy in overall survival.
Subgroup analysis based on the treatment procedure (definitive CRT, preoperative CRT, and postoperative CRT) suggested that CRT was not associated with an increased OS than CT no matter it was performed as definition (HR = 0.94, 95% CI: 0.68, 1.29; P = .705), preoperation (HR = 0.90, 95% CI: 0.79, 1.03; P = .120), or postoperation (HR = 0.92, 95% CI: 0.75, 1.12; P = .390) (Fig. 3).
3.5. PFS
Four studies reported the data of PFS.[20,22,26,27] The aggregated results showed that CRT was not associated with an improvement in PFS (HR = 0.88, 95% CI: 0.75, 1.03; P = .111) (Fig. 4). There was no significant heterogeneity among the included studies (I2 = 0.0%, P = .770).
Figure 4.
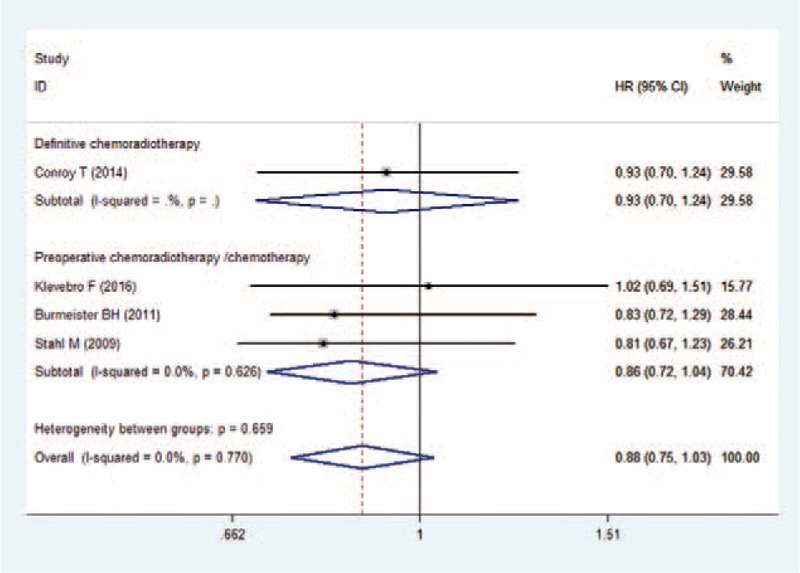
Forest plot showing the comparison between chemoradiotherapy and chemotherapy in progression free survival.
Subgroup analysis based on the treatment procedure demonstrated that, patients treated with definitive CRT (HR = 0.93, 95% CI: 0.70, 1.24; P = .619), or preoperative CRT (HR = 0.86, 95% CI: 0.72, 1.04; P = .114) did not have prolonged PFS when compared with those treated with CT (Fig. 4).
3.6. pCR
Five studies presented the data of pCR.[20,22,23,26,27] Overall, the pCR rate in the CRT group and CT group was 36.9% and 23.2%, respectively. EC patients who were treated with CRT had a higher pCR rate than those treated with CT (RR = 3.62, 95% CI: 1.10, 11.95; P = .035) (Fig. 5). There was significant heterogeneity among the studies (I2 = 89.1%, P < .001). Therefore, we conducted sensitivity analysis to explore the potential sources of heterogeneity. As shown in Fig. 5, the results from the study of Conroy et al[20] were completely out of range of the others, and this study might contribute to the heterogeneity. Thus, we excluded this study; however, the overall estimates of the remaining studies did not change substantially (RR = 5.08, 95% CI: 2.89, 8.95; P < .001). And no evidence of heterogeneity was identified among the studies (I2 = 17.0%, P = .306).
Figure 5.
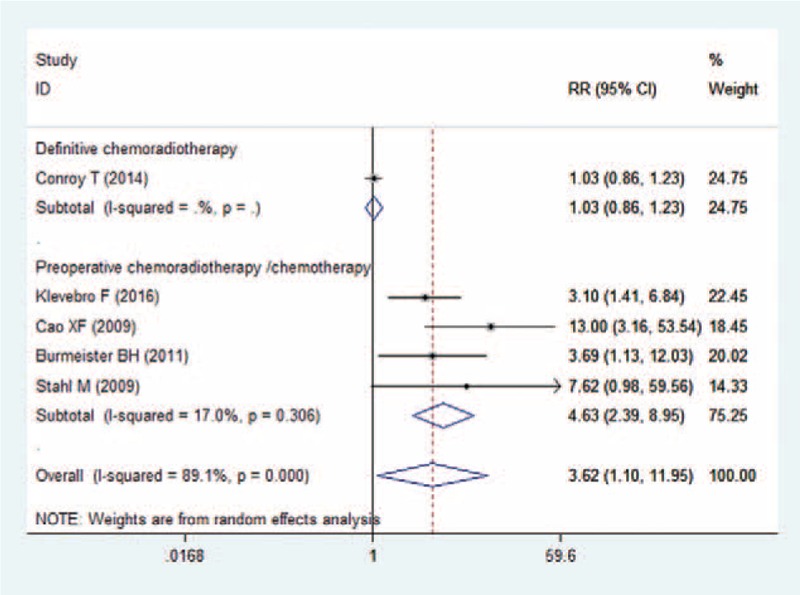
Forest plot showing the comparison between chemoradiotherapy and chemotherapy in pathological complete response.
Subgroup analysis based on the treatment procedure showed that, patients treated with preoperative CRT had a significantly higher pCR rate than those treated with CT (RR = 4.63, 95% CI: 2.39, 8.95; P < 0.05), whereas patients treated with definitive CRT had a similar pCR rate with those treated with CT (RR = 1.03, 95% CI: 0.86, 1.23; P = .764) (Fig. 5).
3.7. R0 resection
Four studies reported the data of R0 resection.[22,23,26,27] Overall, the rate of R0 resection in the CRT group and CT group was 87.5% and 74.1%, respectively. CRT was associated with an increased R0 resection rate (RR = 1.18, 95% CI: 1.09, 1.27; P < .001) (Fig. 6), with no significant heterogeneity among the studies (I2 = 35.5%, P = .199).
Figure 6.

Forest plot showing the comparison between chemoradiotherapy and chemotherapy in R0 resection.
3.8. Recurrence rate
Four studies reported the data of recurrence rate.[21,24,26,27] Overall, recurrence rate in the CRT group and CT group was 45.1% and 49.6%, respectively. Patients treated with CRT had a similar recurrence rate with those treated with CT (RR = 0.91, 95% CI: 0.76, 1.10; P = .346) (Fig. 7). No evidence of significant heterogeneity was observed among the studies (I2 = 0.0%, P = .553).
Figure 7.

Forest plot showing the comparison between chemoradiotherapy and chemotherapy in recurrence rate.
Subgroup analysis based on the treatment procedure suggested that patients treated with preoperative CRT (RR = 1.00, 95% CI: 0.81, 1.23; P = .113) and postoperative CRT (RR = 0.73, 95% CI: 0.50, 1.08; P = .983) had a similar recurrence rate with those treated with CT (Fig. 7).
3.9. Mortality rate
Three studies reported the data of mortality rate.[22,25,27] Overall, the mortality rate in the CRT group and CT group was 13.8% and 5.5%, respectively. Patients who received the CRT had a higher mortality than those who received CT (RR = 2.50, 95% CI: 1.14, 5.48; P = .022) (Fig. 8). There was no significant heterogeneity among the studies (I2 = 0.0%, P = .920).
Figure 8.
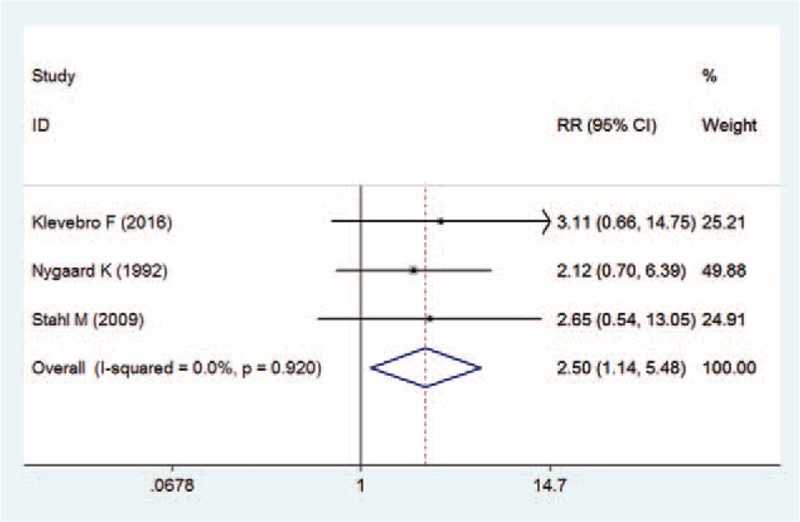
Forest plot showing the comparison between chemoradiotherapy and chemotherapy in mortality rate.
3.10. Adverse events
All the studies reported the data of adverse events.[20–27] Overall, the incidence of grade 3 or 4 adverse events in the CRT group and CT group was 34.3% and 33.4%, respectively. Pooled estimates suggested that there was no significant difference in incidence of grade 3 or 4 adverse events between the 2 groups (RR = 0.91, 95% CI: 0.62, 1.32; P = .612).
4. Discussion
This is a further meta-analysis of 8 RCTs to compare the efficacy and safety of CRT with CT in the treatment of patients with EC. The present meta-analysis suggested that CRT significantly increased the rates of pCR and R0 resection in EC patients, but it did not prolong the PFS and OS. Moreover, patients who received CRT had a higher mortality rate than those who were treated with CT. The incidence of grade 3 or 4 adverse events was not significant difference between the 2 treatments. Our study confirmed that CRT had no survival advantages than CT in the treatment of EC.
There has been 1 published meta-analysis comparing the induction CRT with induction CT for EC.[28] Results from that study suggested that compared with induction CT, induction CRT significantly prolonged OS and disease-free survival (DFS), and it also increased the complication rate.[28] Our study expands on the previous meta-analysis to provide a better characterization of the evidence base for CRT and CT in the treatment of EC patients. First, there were more eligible RCTs and enlarged sample size in our analysis, which gives greater power to compare the effects of CRT with CT in EC patients. In this meta-analysis, 8 RCTs with a total of 1274 patients were included, whereas in the previous meta-analysis, only 5 studies with 678 patients were included. Second, all the studies included in this meta-analysis were prospectively, randomized controlled phase 2/3 trials. Whereas in the previous meta-analysis, only 3 studies were RCTs, and the other 2 were nonrandomized cross-comparison study and retrospective study.[28] Observational studies were highly subject to selection bias and confounding by indication. Furthermore, we were able to evaluate the effects of CRT and CT in the R0 resection and recurrence rate, which had not been discussed in the previous meta-analysis.
Whether esophageal and esophagogastric-junction tumors should be treated with preoperative CRT or with perioperative CT remains unclear. In the Medical Research Council Adjuvant Gastric Infusional Chemotherapy (MAGIC) trial[29] and the Actions Concertees dans les Cancer Colorectaux et Digestifs (ACCORD) 07 trial,[30] both results demonstrated that a perioperative CT significantly improved the OS and PFS in patients with operative gastric or lower esophageal ACs. However, these trials included gastric tumors as well as esophagogastric-junction tumors, and whether preoperative CT had benefit effect in esophagogastric-junction tumors still remained uncertain. In a phase 3 trial,[27] all the patients included were esophagogastric-junction tumors, and they were randomly assigned to preoperative CRT or CT. The results suggested that preoperative CRT had a survival advantage than preoperative CT, but this was not statistically significant. Similarly, Van Hagen et al[31] conducted a clinical trial comparing CRT followed by surgery with surgery in patients with esophageal or esophagogastric-junction tumors. In that study, there was a substantial percentage of patients in CRT group had an esophagogastric-junction tumor (22%), and patients in CRT group had a prolonged survival. Thus, the authors supported the treatment of preoperative CRT for patients with esophagogastric-junction tumors.
In this meta-analysis, we found that CRT could not significantly improve OS and PFS in the treatment of EC patients as compared with CT. Our results were in consistent with all of the included studies. Klevebro et al[22] conducted a randomized clinical trial of neoadjuvant CRT (nCRT) versus neoadjuvant CT(nCT) for cancer of the oesophagus or gastroesophageal junction. In that study, patients in the nCT group were given 3 cycles of cisplatin (100 mg/m2) and fluorouracil (750 mg/m2), whereas those in nCRT group were given 40 Gy with a photon beam linear accelerator concomitant with CT.[22] At the end of 3-year follow-up, the OS in the nCRT and nCT groups was 47% and 49%, respectively (P = .77), and PFS in both groups was 44%.[22] These results suggested that nCRT had no survival advantage over nCT.
However, in a recently published meta-analysis, Fan, et al reported converse results, in which CRT achieved a long-term survival benefit in EC patients.[28] In that study, 5 studies that compared EC patients undergoing resection after treatment with CRT or CT were included.[28] Pooled data suggested that patients who received CRT obtained longer OS (HR = 0.73, 95% CI: 0.61, 0.89; P = .02) and DFS (HR = 0.73, 95% CI: 0.54, 0.98; P = .037) compared with those who were treated with CT.[28] In consideration of the small sample size and poor quality of the included studies in the previous meta-analysis, it is possible that the survival effects of CRT might be overestimated. First, among the 5 studies, only 3 were RCTs and the remaining 2 were observational studies. Observational studies have poor methodological quality than RCTs and are subject to selection bias. Second, in the data analysis for OS, only 1 study reported a significant survival difference between the two treatments, and the remaining four did not. Third, the data analysis for DFS was conducted based on only 2 studies. The aggregated results from small sample size of the 2 studies may not be robust and reliable.
Despite CRT did not show survival benefits in EC patients, a trend toward prolonged survival of CRT was observed in patients with SCC,[26] and a trend toward poor survival was found in patients with AC.[22] In a prospectively randomized phase III trial, patients with locally advanced SCC were randomly allocated to receive CRT followed by surgery or CT followed by surgery.[26] At the date of evaluation, median survival in CRT and CT groups was 33.1 (95% CI: 24.0, open) and 21.2 (95% CI: 15.2, 27.2) months, respectively, which favored the CRT arm.[26] In another clinical trial, patients were treated with 3 cycles of platin/5-fluorouracil or platin/5-fluorouracil with concomitant radiotherapy.[22] The 3-year OS in the CT and CRT arms was 49% and 47%, respectively (P = .77).[22] Subgroup analysis based on tumor type also showed a longer OS of CT in the AC patients, although the difference was not statistically significant (HR = 1.06, 95% CI: 0.68, 1.66).[22] The authors suggested that the decreased OS time in CRT group could be explained by the lower radiotherapy dosage, which was 40 Gy.[22] However, because of the limited data, we were unable to conduct subgroup analysis based on tumor types to explore whether CRT had different survival effects in different types of EC.
With regard to the pCR, our results demonstrated that, EC patients who were treated with CRT had a significantly higher pCR rate than those treated with CT. pCR has been shown to be a good prognostic indicator in patients who have had CRT.[32,33] Previous studies have indicated that patients who have <10% viable tumor cells also have similar positive outcomes.[32–34] Although EC patients who have preoperative CRT achieve significantly prolonged pCR compared with those treated with CT, the survival outcomes between these patients were not significant different. One possible reason for this is that the addition of radiotherapy to CT may have no impact on the survival of a disease that has a high rate of systemic metastasis.[26]
There were several potential limitations in this meta-analysis that should be considered when interpreting our results. First, our study was conducted based on 8 RCTs, and 3 of them had a relatively small sample size (N < 100). Compared with large trials, studies with small sample size were more likely to overestimate the treatment effects. Second, these included studies lacked homogeneity in patients’ characteristics (age, tumor type, tumor location, ECOG performance status, and clinical stage), and treatment regimen (dosage of the chemotherapeutic regimens, and dosage of the radiation). These factors may increase the heterogeneity and have potential impact on the results. Third, because of the sparse data, we were unable to conduct subgroup analysis to assess the effects of CRT with CT in different pathological types of EC.
In summary, this meta-analysis indicates that CRT was associated with significantly increased pCR rate, R0 resection rate, and mortality rate in the treatment of EC, but it had no effects in survival outcomes. Moreover, in the subgroup analysis, no differences in OS and PFS were noted for patients receiving definitive, pre-operative, or postoperative CRT and those receiving CT. Preoperative CRT had a significantly higher pCR rate than CT. Despite no difference in survival, the improvement from CRT with respect to the pCR and R0 resection rate makes this treatment a reasonable option for EC. Considering the potential limitations in this study, further large-scale and well-conducted RCTs are needed to validate our findings, and investigate the effects of 2 treatments in different pathological types of EC.
Footnotes
Abbreviations: AC = adenocarcinoma, ASC = adenosquamous carcinoma, CRT = chemoradiation therapy, CT = chemotherapy, EC = esophageal carcinoma, nCRT = neoadjuvant CRT, nCT = neoadjuvant CT, OS = overall survival, pCR = pathological complete response, PFS = progression free survival, PRISMA = Preferred Reporting Items for Systematic Reviews and Meta-analysis, RCT = randomized controlled trial, RR = risk ratio, SCC = squamous cell carcinoma.
JL, LX, and FZ are co-first authors.
Funding: This research received no specific grant from any finding agency in the public, commercial or not-for-profit sectors.
The authors report no conflicts of interest.
References
- [1].Ferlay J, Soerjomataram I, Ervik M. GLOBOCAN 2012 V 1.0, Cancer Incidence andMortalityWorldwide: IARC CancerBase No 11 [Internet]. Lyon, France: International Agency for Research on Cancer; 2013. [Google Scholar]
- [2].Lagarde SM, Cense HA, Hulscher JB, et al. Prospective analysis of patients with adenocarcinoma of the gastric cardia and lymph node metastasis in the proximal field of the chest. Br J Surg 2005;92:1404–8. [DOI] [PubMed] [Google Scholar]
- [3].Dresner SM, Lamb PJ, Bennett MK, et al. The pattern of metastatic lymph node dissemination from adenocarcinoma of the esophagogastric junction. Surgery 2001;129:103–9. [DOI] [PubMed] [Google Scholar]
- [4].Siewert JR, Stein HJ, Feith M, et al. Histologic tumor type is an independent prognostic parameter in esophageal cancer: lessons from more than 1,000 consecutive resections at a single center in the Western world. Ann Surg 2001;234:360–7. [DOI] [PMC free article] [PubMed] [Google Scholar]
- [5].Yamashita H, Seto Y, Takenaka R, et al. Survival comparison between radical surgery and definitive chemoradiation in 267 esophageal squamous cell carcinomas in a single institution: a propensity-matched study. PLoS One 2017;12:e0177133. [DOI] [PMC free article] [PubMed] [Google Scholar]
- [6].Steffen T, Dietrich D, Schnider A, et al. Recurrence patterns and long-term results after induction chemotherapy, chemoradiotherapy, and curative surgery in patients with locally advanced esophageal cancer. Ann Surg 2017;https://www.ncbi.nlm.nih.gov/pubmed/?term=Steffen+T%2C+Dietrich+D%2C [DOI] [PubMed] [Google Scholar]
- [7].Shapiro J, van Lanschot JJ, Hulshof MC, et al. Neoadjuvant chemoradiotherapy plus surgery versus surgery alone for oesophageal or junctional cancer (CROSS): long-term results of a randomised controlled trial. Lancet Oncol 2015;16:1090–8. [DOI] [PubMed] [Google Scholar]
- [8].Liu S, Qiu B, Luo G, et al. TNM staging matched-pair comparison of surgery after neoadjuvant chemoradiotherapy, surgery alone and definitive chemoradiotherapy for thoracic esophageal squamous cell carcinoma. J Cancer 2017;8:683–90. [DOI] [PMC free article] [PubMed] [Google Scholar]
- [9].Higgins J. S.G. Cochrane handbook for systematic reviews of interventions version 5.1.0. Oxford: The Cochrane Collaboration; 2011. [Google Scholar]
- [10].Tierney JF, Stewart LA, Ghersi D, et al. Practical methods for incorporating summary time-to-event data into meta-analysis. Trials 2007;8:16. [DOI] [PMC free article] [PubMed] [Google Scholar]
- [11].Higgins JP, Altman DG, Gotzsche PC, et al. The Cochrane Collaboration's tool for assessing risk of bias in randomised trials. BMJ (Clinical research ed) 2011;343:d5928. [DOI] [PMC free article] [PubMed] [Google Scholar]
- [12].Guyatt GH, Oxman AD, Vist GE, et al. GRADE: an emerging consensus on rating quality of evidence and strength of recommendations. BMJ (Clinical research ed) 2008;336:924–6. [DOI] [PMC free article] [PubMed] [Google Scholar]
- [13].Higgins JP, Thompson SG, Deeks JJ, et al. Measuring inconsistency in meta-analyses. BMJ (Clinical research ed) 2003;327:557–60. [DOI] [PMC free article] [PubMed] [Google Scholar]
- [14].Mantel N, Haenszel W. Statistical aspects of the analysis of data from retrospective studies of disease. J Natl Cancer Inst 1959;22:719–48. [PubMed] [Google Scholar]
- [15].DerSimonian R, Laird N. Meta-analysis in clinical trials. Control Clin Trials 1986;7:177–88. [DOI] [PubMed] [Google Scholar]
- [16].Song F, Eastwood AJ, Gilbody S, et al. Publication and related biases. Health Technol Assess 2000;4:1–15. [PubMed] [Google Scholar]
- [17].Lledo G, Huguet F, Chibaudel B, et al. Chemoradiotherapy with FOLFOX plus cetuximab in locally advanced oesophageal cancer: The GERCOR phase II trial ERaFOX. Eur J Cancer 2016;56:115–21. [DOI] [PubMed] [Google Scholar]
- [18].Yang JS, Wang T, Qiu MQ, et al. Comparison of efficacy and toxicity profiles between paclitaxel/lobapoatin- and cisplatin/5-fluorouracil-based concurrent chemoradiotherapy of advanced inoperable oesophageal cancer. Intern Med J 2015;45:757–61. [DOI] [PubMed] [Google Scholar]
- [19].Shinoda M, Ando N, Kato K, et al. Randomized study of low-dose versus standard-dose chemoradiotherapy for unresectable esophageal squamous cell carcinoma (JCOG0303). Cancer sci 2015;106:407–12. [DOI] [PMC free article] [PubMed] [Google Scholar]
- [20].Conroy T, Galais MP, Raoul JL, et al. Definitive chemoradiotherapy with FOLFOX versus fluorouracil and cisplatin in patients with oesophageal cancer (PRODIGE5/ACCORD17): final results of a randomised, phase 2/3 trial. Lancet Oncol 2014;15:305–14. [DOI] [PubMed] [Google Scholar]
- [21].A comparison of chemotherapy and radiotherapy as adjuvant treatment to surgery for esophageal carcinoma. Japanese Esophageal Oncology Group. Chest 1993;104:203–7. [DOI] [PubMed] [Google Scholar]
- [22].Klevebro F, Alexandersson von Dobeln G, Wang N, et al. A randomized clinical trial of neoadjuvant chemotherapy versus neoadjuvant chemoradiotherapy for cancer of the oesophagus or gastro-oesophageal junction. Ann Oncol 2016;27:660–7. [DOI] [PubMed] [Google Scholar]
- [23].Cao XF, He XT, Ji L, et al. Effects of neoadjuvant radiochemotherapy on pathological staging and prognosis for locally advanced esophageal squamous cell carcinoma. Dis Esophagus 2009;22:477–81. [DOI] [PubMed] [Google Scholar]
- [24].Tachibana M, Yoshimura H, Kinugasa S, et al. Postoperative chemotherapy vs chemoradiotherapy for thoracic esophageal cancer: a prospective randomized clinical trial. Eur J Surg Oncol 2003;29:580–7. [DOI] [PubMed] [Google Scholar]
- [25].Nygaard K, Hagen S, Hansen HS, et al. Pre-operative radiotherapy prolongs survival in operable esophageal carcinoma: a randomized, multicenter study of pre-operative radiotherapy and chemotherapy. The second Scandinavian trial in esophageal cancer. World J Surg 1992;16:1104–9. [DOI] [PubMed] [Google Scholar]
- [26].Burmeister BH, Thomas JM, Burmeister EA, et al. Is concurrent radiation therapy required in patients receiving preoperative chemotherapy for adenocarcinoma of the oesophagus? A randomised phase II trial. Eur J Cancer 2009;27:851–6. [DOI] [PubMed] [Google Scholar]
- [27].Stahl M, Walz MK, Stuschke M, et al. Phase III comparison of preoperative chemotherapy compared with chemoradiotherapy in patients with locally advanced adenocarcinoma of the esophagogastric junction. J Clin Oncol 2009;27:851–6. [DOI] [PubMed] [Google Scholar]
- [28].Fan M, Lin Y, Pan J, et al. Survival after neoadjuvant chemotherapy versus neoadjuvant chemoradiotherapy for resectable esophageal carcinoma: a meta-analysis. Thorac Cancer 2016;7:173–81. [DOI] [PMC free article] [PubMed] [Google Scholar]
- [29].Cunningham D, Allum WH, Stenning SP, et al. Perioperative chemotherapy versus surgery alone for resectable gastroesophageal cancer. N Engl J Med 2006;355:11–20. [DOI] [PubMed] [Google Scholar]
- [30].Ychou M, Boige V, Pignon JP, et al. Perioperative chemotherapy compared with surgery alone for resectable gastroesophageal adenocarcinoma: an FNCLCC and FFCD multicenter phase III trial. J Clin Oncol 2011;29:1715–21. [DOI] [PubMed] [Google Scholar]
- [31].van Hagen P, Hulshof MC, van Lanschot JJ, et al. Preoperative chemoradiotherapy for esophageal or junctional cancer. N Engl J Med 2012;366:2074–84. [DOI] [PubMed] [Google Scholar]
- [32].Brucher BL, Becker K, Lordick F, et al. The clinical impact of histopathologic response assessment by residual tumor cell quantification in esophageal squamous cell carcinomas. Cancer 2006;106:2119–27. [DOI] [PubMed] [Google Scholar]
- [33].Schneider PM, Baldus SE, Metzger R, et al. Histomorphologic tumor regression and lymph node metastases determine prognosis following neoadjuvant radiochemotherapy for esophageal cancer: implications for response classification. Ann Surg 2005;242:684–92. [DOI] [PMC free article] [PubMed] [Google Scholar]
- [34].Barbour AP, Jones M, Gonen M, et al. Refining esophageal cancer staging after neoadjuvant therapy: importance of treatment response. Ann Surg Oncol 2008;15:2894–902. [DOI] [PubMed] [Google Scholar]


