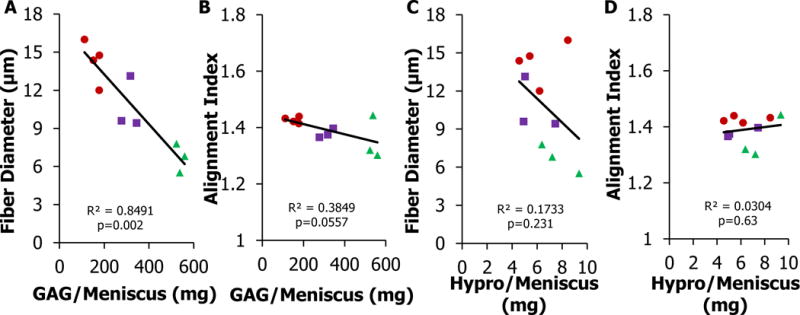
Figure 7.

Fiber formation and biochemical content relationship in tissue engineered menisci (A-B) Total GAG content per meniscus compared to fiber diameter and alignment index. (C-D) Total Hypro content per meniscus compared to fiber diameter and alignment index. Fiber diameter is strongly correlated to GAG/Meniscus (p<0.05, R2>0.80). <R>
 FCC, <B>
 50/50, <G>
 MSC.
MSC.
