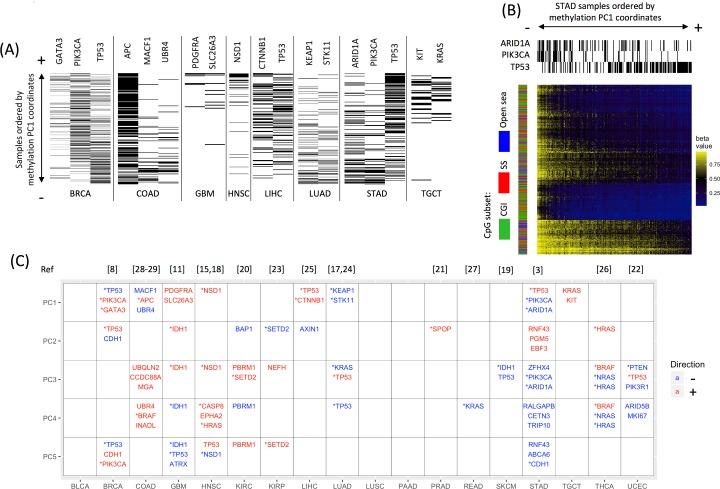
Fig 1. Driver gene mutations are significantly associated with DNA methylation in various cancers.
(A) Examples of mutations in 15 driver genes that display an uneven distribution along the first principal component (PC1) of DNAm, biased toward either the positive extreme (+) or the negative extreme (-). Tumor samples are ordered vertically by their coordinates on PC1, from small (-, bottom) to large (+, top). A black line indicates the presence of the mutated driver gene in a sample, whereas a white line indicates its absence. Note that a sample’s presence at an extreme (+/-) of a PC does not necessarily correspond to high or low methylation. See Table 1 for cancer type abbreviations. (B) Example of a cancer with driver gene mutations unevenly distributed on PC1, resulting in distinct methylation patterns: ARID1A/PIK3CA-mutated stomach adenocarcinomas (STADs) display a methylation pattern distinct from TP53-mutated STADs. Shown is a heat map of methylation levels for the top 1,000 most heavily weighted probes in PC1. Each column represents a sample ordered by its PC1 coordinate, from small (-, left) to large (+, right). Each row represents a probe site. The three column sidebars on the top indicate mutation status for TP53, PIK3CA, and ARID1A. The row sidebar indicates the CpG subsets: CpG island (CGI), shores and shelves (SS; the 4-kb regions flanking the CGIs), or open sea (i.e., probes outside of CGIs and SSs). TP53-mutated STADs display lower methylation levels at the selected CpG sites than the majority of ARID1A/PIK3CA-mutated STADs. (C) In 15 of 18 cancer types examined, mutated driver genes were associated with one or more of the top five methylation PCs, shown as rows. The three driver genes most significantly associated with each PC are reported. Driver genes associated with the negative extreme of a PC are in blue, whereas associations with the positive extreme are in red. *Some of these mutated driver genes were previously reported in association with DNAm subtypes (corresponding references listed at the top).

