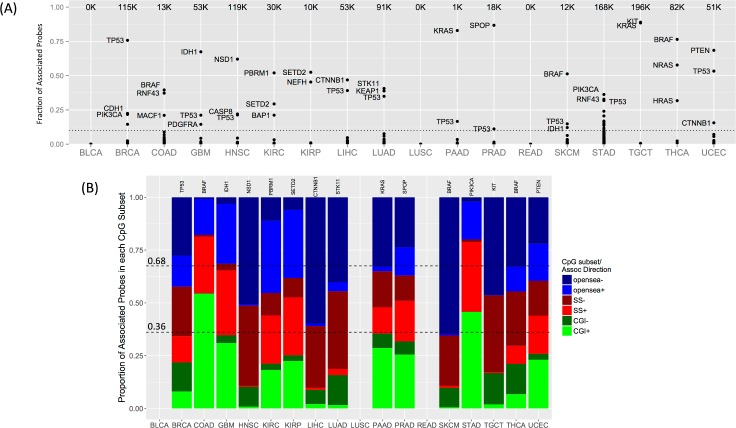
Fig 2. Driver gene–methylation associations and CpG subsets.
(A) The total number of probes associated with any driver gene is shown for each cancer type (top of each column). Each point represents the fraction of corresponding probes associated with a driver gene (y-axis). Names are shown for each of the top three driver genes if they account for more than 10% of total probes (dotted line). See Table 1 for cancer type abbreviations. (B) Driver genes with the most probe associations in each cancer type (gene names in panel). The bar plots show the proportion of associated probes in each of the three CpG subsets [CpG islands (CGIs), shores and shelves (SSs), or open sea], stratified by the direction of association (+/-). Dashed lines indicate the divisions expected if associations were proportionally distributed. No probes were associated with driver genes in BLCA, LUSC, and READ.

