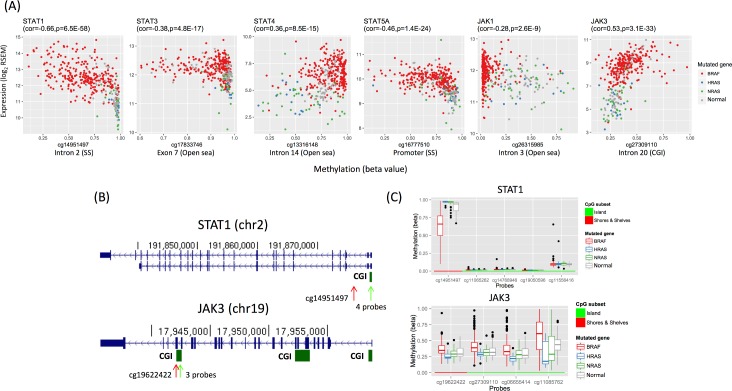
Fig 5. Differential expression of JAK and STAT family genes is correlated with differential methylation in thyroid cancer subtypes.
(A) Shown are scatter plots for gene expression levels (y-axis) and methylation levels (x-axis) for STAT1, STAT3, STAT4, STAT5A, JAK1, and JAK3, plotted with BRAF-mutated (red), HRAS-mutated (blue), NRAS-mutated (green), and normal (grey) samples. Gene names and Spearman rho values (with p-values) for the correlation between gene expression and methylation among tumor samples are shown on top of the plots. Probe names (where methylation levels were measured) and genomic locations are shown on the bottom of the plots. (B) Snapshots from the UCSC genome browser for STAT1 and JAK3, with CpG islands (CGIs) indicated below (green arrow: CGIs; red arrow: probes flanking the CGIs). Methylation levels of the indicated regions are shown in panel (C). (C) Box plots show methylation levels (y-axis) at probes in STAT1 and JAK3 for BRAF-mutated, HRAS-mutated, NRAS-mutated, and normal samples. The shown probes fall in the north shores and shelves [or SSs, indicated by red arrows in (B)] of the STAT1 promoter CGI and the 3’ CGI of JAK3 [indicated by green arrows in (B)].

