Figure 1.
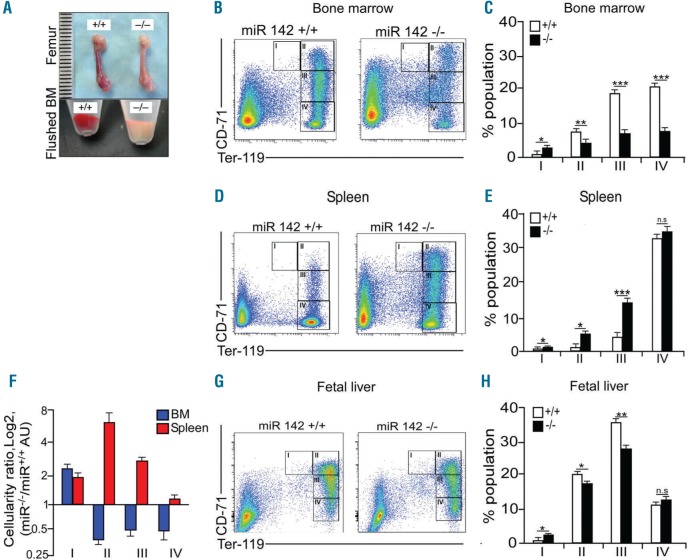
Ineffective erythropoiesis in miR-142−/− animals. (A) Macroscopic appearance of freshly dissected wild-type WT, +/+ and miR-142 deficient (−/−) femurs, or flushed bone marrow (BM). (B) Representative flow cytometry profiles of WT (+/+) and miR-142 deficient (−/−) BM erythorid cell populations and (C) quantification (n=3 mice, per group). Roman numerals indicate developmentally defined subpopulations: I-Ter119MEDCD71HI, pro-erythroblasts; II- Ter119HICD71HI, basophilic erythroblasts; III- Ter119HICD71MED, polychromatophilic erythroblasts; IV-Ter119HICD71NEG, orthochromatophilic erythroblasts to mature erythrocytes. (D) Representative flow cytometry profiles of WT (+/+) and miR-142 deficient (−/−) spleen erythroid populations and (E) quantification (n=3 animals per group). (F) Relative spleen (red) and bone marrow (blue) cellularity, presented as log2 of miR-142−/− value divided by miR-142+/+ value. (G) Representative flow cytometry profiles of WT (+/+) or miR-142 deficient (−/−) erythroid populations from fetal liver and (H) quantification (n=3 mice, per group). Two-tailed Student t-test, Error bars, mean ± Standard Error of Mean, *P<0.05; **P<0.01; ***P<0.001; ns: not significant.

