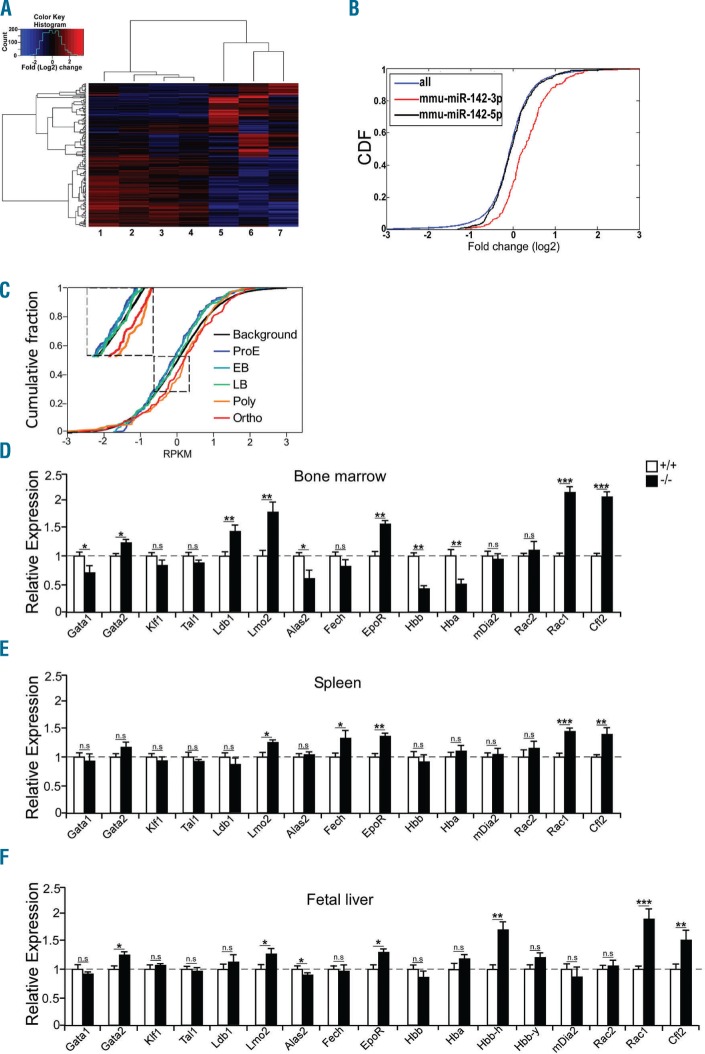
Figure 2.
The widespread molecular signature of miR-142 on the transcriptome in mouse and human erythropoiesis. (A) Hierarchical heat map gene clustering of 200 differentially expressed CFUe mRNAs of miR-142 deficient (samples 1–4) and control wild-type (WT, samples 5–7). Log2 fold-change of differential values. (B) Cumulative distribution function (CDF) plot reveals de-repression (upregulation) of transcripts with miR-142-3p binding sites in miR-142-deficient CFUe (red), relative to background gene expression of all transcripts (blue) or to predicted miR-142-5p targets (black). (C) CDF plot of miR-142-3p.1 targets (TargetScan,4 167 genes), in five human-erythroid differentiation stages. Reanalysis of global transcriptome data (n=3 experimental repeats per stage; GEO accession GSE53983).5 Log2 of RPKM values. Normalized CDF of all 9800 expressed mRNAs (background), were similar in the five differentiation stages and presented as a single black line. ProE: proerythroblast; EB: early basophilic; LB: late basophilic; Poly: polychromatic; Ortho: orthochromatic. qPCR analysis of miR-142 targets and erythropoiesis marker mRNAs in TER119+ cells from miR-142 deficient or WT bone marrow (D), spleen (E) or fetal liver (F), normalized to HPRT (n=3 mice, per group). Two-tailed Student t-test. Error bars, mean ± Standard Error of Mean, *P<0.05; **P<0.01; ***P<0.001; n.s: not significant.

