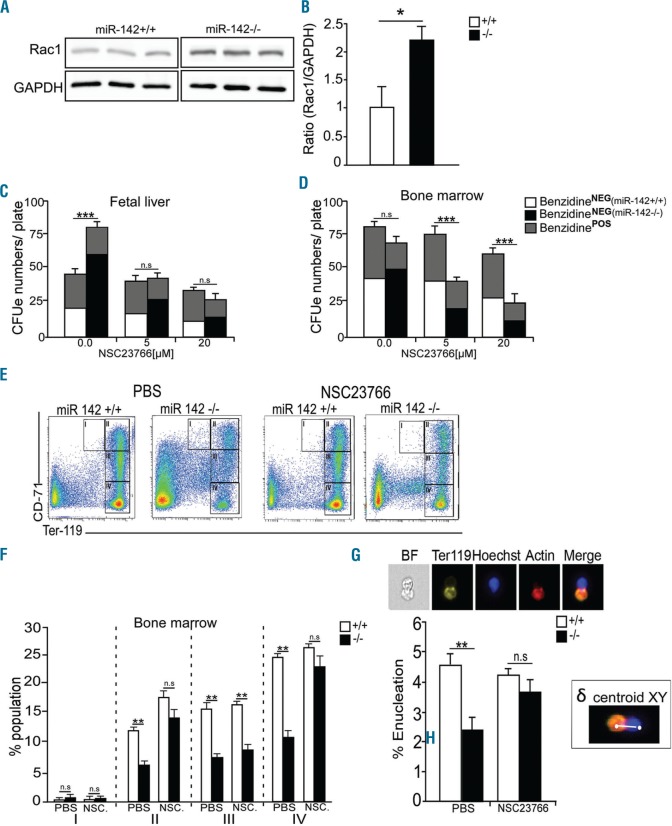
Figure 3.
Rac1 functions downstream of miR-142-3p in regulating erythropoiesis. (A) Western blot study of Rac1 and GAPDH (loading control) in cell lysates from wild-type (WT) (+/+) and miR-142 deficient (−/−) bone marrow and (B) bar graph quantification of Rac1/GAPDH ratio (n=3 animals per group). Quantification of miR-142 deficient (−/−) BFUe / CFUe, with different concentrations of Rac1 inhibitor, NSC23766, in fetal liver (C) or bone marrow (D). Upper bars (gray) represent the numbers of differentiating colonies, which were stained with benzidine, from total colony numbers. (E) Representative flow cytometry of erythroid bone marrow subpopulations and (F) percentile quantification after in vivo administration of carrier (PBS) or NSC23766 (2.5 mg/kg/day, intraperitoneally, for 10 days) to WT and miR-142 deficient animals (n=4 animals per group. NSC - NSC23766). Roman numerals indicate developmentally defined sub-populations: I-Ter119MEDCD71HI: pro-erythroblasts; II- Ter119HICD71HI: basophilic erythroblasts; III- Ter119HICD71MED: polychromatophilic erythroblasts; IVTer119HICD71NEG, orthochromatophilic erythroblasts to mature erythrocytes. (G) Representative images of bone marrow cells, stained with Ter119-PE (yellow), Hoechst (nucleus, blue) and 647-Phalloidin (F-actin, red) and percentile quantification of enucleation in WT and mutant miR-142−/− bone marrow, by ImageSteramX cytometry (n=3 mice, per group). White bar depicts the measurement of δ centroid XY signal in a micrograph of an enucleating erythroblast with highly eccentric Ter119 - Hoechst signal. Parameters described in Online Supplementary Methods and Online Supplementary Figure S4. Two-tailed Student t-test, Error bars, mean± Standard Error of Mean, *P<0.05; **P<0.01; ***P<0.001; n.s: non significant.

