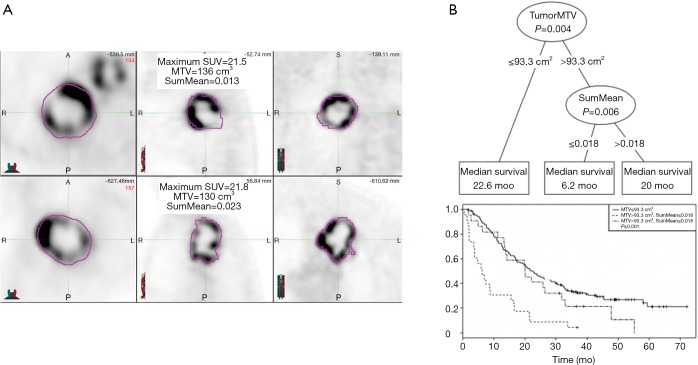
Figure 4.
Modeling of patient survival using PET imaging. (A) PET images from two sample patients whose tumors had similar metabolic tumor volume and SUVmax and similar appearances, but had disparate SumMean values. Both tumors were scored as markedly heterogeneous based on visual examination. Survival time for the patient in the upper panel was 15.5 months, compared to 47.8 months for the patient in the lower panel; (B) conditional inference tree for the combination of metabolic tumor volume and SumMean as predictors of overall survival (top), and corresponding Kaplan-Meier curves for overall survival for the three groups resulting from the tree-defined cutpoints (bottom). PET, positron emission tomography; SUV, standard uptake value.

