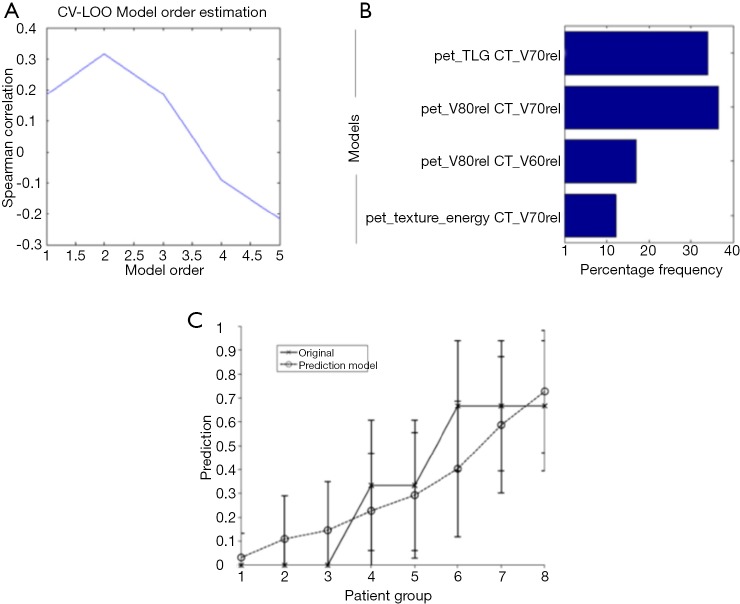
Figure 6.
Image-based modeling of local failure from PET/CT features. (A) Model order selection using leave-one-out cross-validation; (B) most frequent model selection using bootstrap analysis where the y-axis represents the model selection frequency on resampled bootstrapped samples; (C) plot of local failure probability as a function of patients binned into equal-size groups showing the model prediction of treatment failure risk and the original data [reproduced with permission from Vaidya et al., 2012 (21)]. PET, positron emission tomography; CT, computed tomography.

