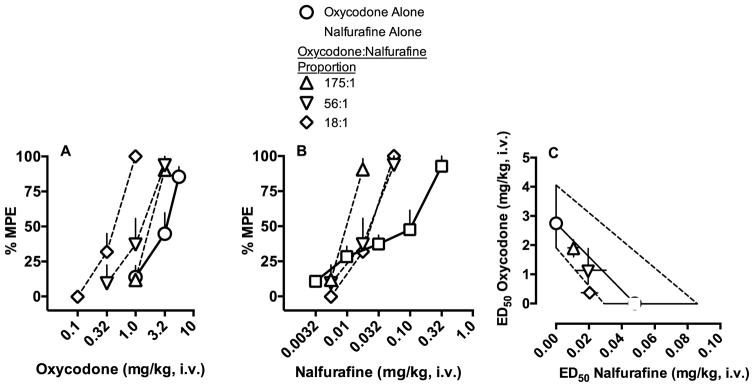
Figure 3.
Thermal antinociceptive potency of oxycodone, nalfurafine, and three mixture proportions (Experiment 3). Effects of cumulative oxycodone and nalfurafine (mg/kg, i.v.) are depicted as percent maximum possible effect (%MPE) ±SEM across dose of either oxycodone (Figure 3A) or nalfurafine (Figure 3B). Thermal antinociceptive relationship of oxycodone and nalfurafine at the ED50 effect level are depicted as an isobologram in Figure 3C. The y-axis represents the ED50 value and 95% confidence limits in terms of oxycodone dose (mg/kg) and the x-axis represents the ED50 value and 95% confidence limits in terms of nalfurafine dose. The line connecting the ED50 value for oxycodone and nalfurafine alone represents the coordinates of predicted additive values. The dashed line represents values within the 95% confidence limits of additivity.

