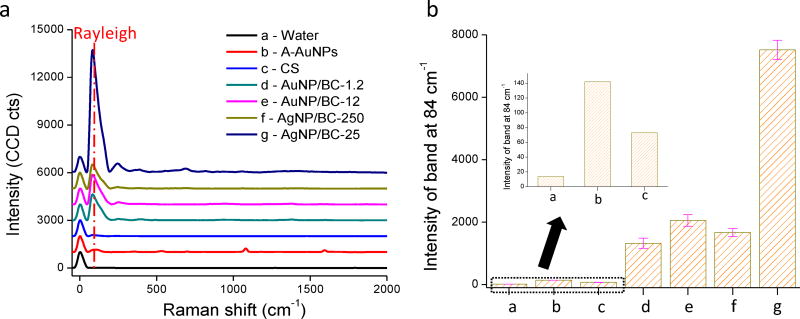
Figure 2.
a) Raman spectra of the SERS substrates without analyte addition (a. water; b. A-AuNPs; c. commercial substrate (CS); d. AuNP/BC-1.2; e. AuNP/BC-12; f. AgNP/BC-250; g. AgNP/BC-25); b) Intensities of the Rayleigh band at 84 cm−1 of all substrates; Inset shows the intensities of the Rayleigh band at 84 cm−1 for substrates a–c.

