Fig. 1.
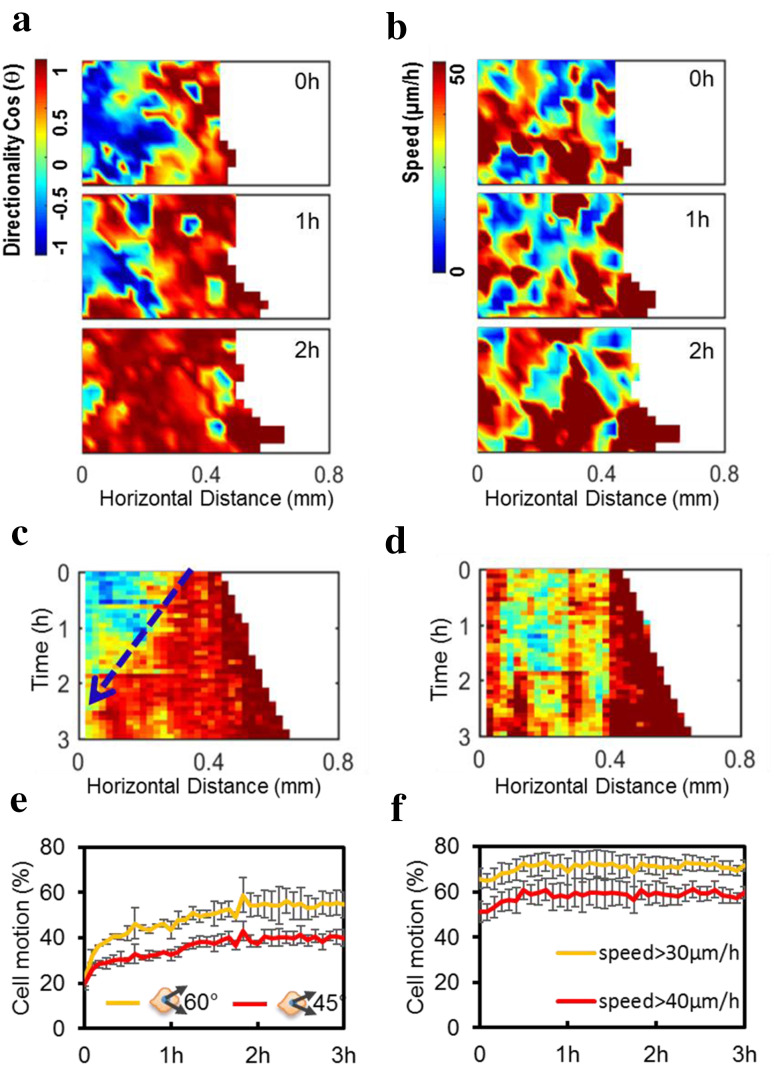
Free edge induced a wave-like propagation of directionality but not the speed in confluent epithelial cells. a Heat maps of cell migration directionality at different time points show the increase in directionality as a wave propagating from the leading cells into the following cells after removal of the PDMS barrier. “Hot” colors like red show migration to the right, into the free space. “Cold” colors like blue show migration to the left, away from the free space. b Heat maps of cell migration speed, however, lack a similar wave propagation from the leading cells into the following cells. c Kymograph showing an increase in directionality propagating from the leading edge into the cell sheet along time (blue arrow); by 3 h, all the cells migrated directionally to the right (coded red). d Kymograph coding migration speed shows that speed increased at the leading edge, but did not propagate into the cell sheet. e, f After PDMS barrier removal, cells showed increased directionality: the proportion of cell motion directed to the free edge within a bias angle less than 60° or 45° increased over time (e), while the fraction of cells with a speed over 30 or 40 µm/h remained stable (f). Directionality and speed of cell migration were calculated using PIV (see “Materials and methods”). Color indicates the value of cosine theta (directionality) from −1 to 1 (a) or the cell speed from 0 to 50 µm/h (b). Data are presented as mean ± SD from three independent experiments

