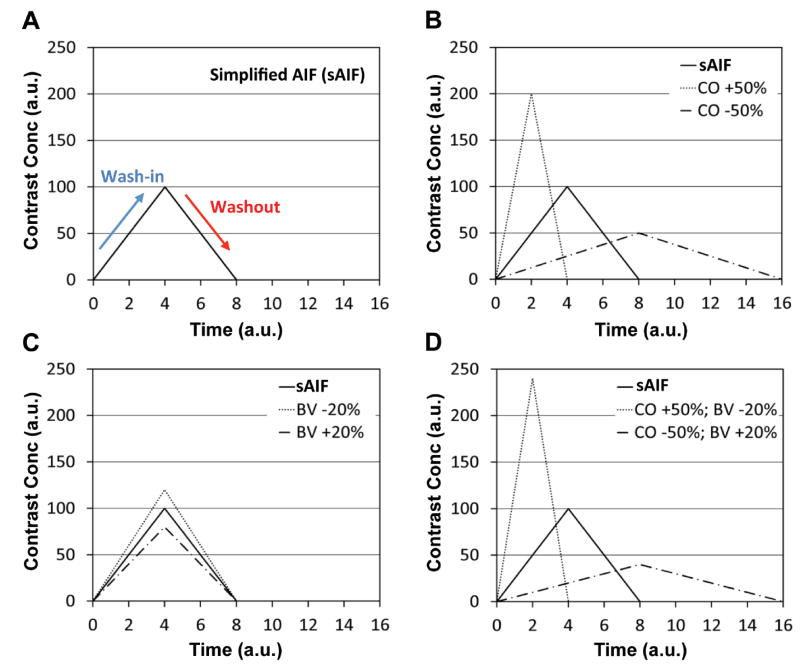
Figure 1.
Illustration of AIFs according to the individual variation. (A) An AIF simplified with a triangular function (sAIF). (B) AIFs when cardiac output is 50% higher (CO +50%) or 50% lower (CO −50%) than that of sAIF. (C) AIFs when blood volume is 20% higher (BV +20%) or 20% lower (BV −20%) than that of sAIF. (D) AIFs when cardiac output is 50% higher and blood volume is 20% lower (CO +50%; BV −20%) or when cardiac output is 50% lower and blood volume is 20% higher (CO −50%; BV +20%).

