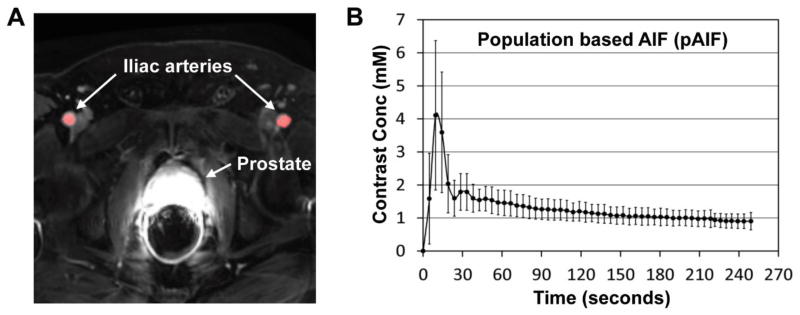
Figure 4.
Representative DCE-MRI image and the population based AIF. (A) A representative DCE-MRI image. Two iliac arteries and the prostate are indicated with white arrows. The ROI for AIF determination is highlighted in red. (B) The population based AIF (pAIF) obtained in this study (mean and SD).

