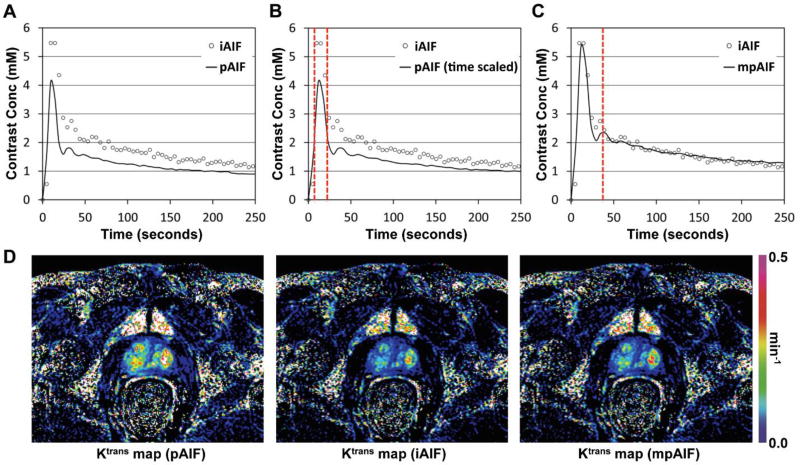
Figure 5.
Procedure of obtaining the modified population-based AIF (mpAIF). (A) The population-based AIF (pAIF) and an individualized AIF (iAIF) indicated with a solid curve and circular dots. (B) pAIF scaled in time to match its FWHM with that of iAIF, indicated with two dotted vertical lines. (C) Time and amplitude scaled pAIF (mpAIF) fitting into the iAIF after the second peak indicated with a dotted vertical line. (D) Three Ktrans maps of a patient when pAIF, iAIF and mpAIF shown in Figs. 5A–C were used, respectively. The same color scale was applied for all images.

