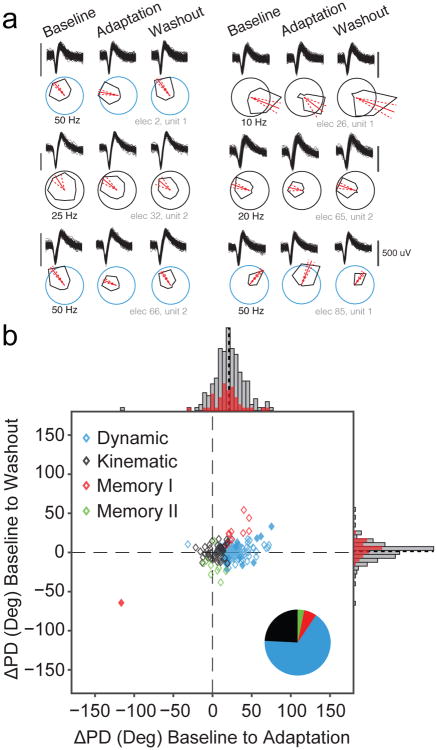
Fig. 3. Neural PD changes.
a) Waveforms and tuning curves for six representative cosine-tuned units recorded from one session of Monkey C during the Baseline period and the final third of trials in the Adaptation and Washout periods. The black scale bar next to the waveforms indicates 500 uV. The red line indicates the PD, and the dashed red lines denote the 95% confidence bounds on the PD. The scaling circles are colored according to the cell classification. b) Change in preferred direction (ΔPD) from the Baseline to Adaptation epochs (abscissa) and from the Baseline to the Washout (ordinate). Histograms indicate marginal distributions, with gray being all tuned cells, and red being the best isolated cells (SNR > 6). Black dashed lines on the histograms represent the mean change from baseline for each distribution (21° in Adaptation and 1.6° in Washout). Most PDs changed significantly during Adaptation and reverted to their original tuning in Washout. Symbol colors and pie chart (inset) shows the proportion of each cell type for the population. The Dynamic and Memory I cells with solid fills represent Other cells that were reclassified using the Memory Cell index (see Methods).

